- Go to https://backoffice-console.mosaic-pos.com/#/auth/login
- Log in to the Mosaic Analytics using your account.
- Click “Log In”
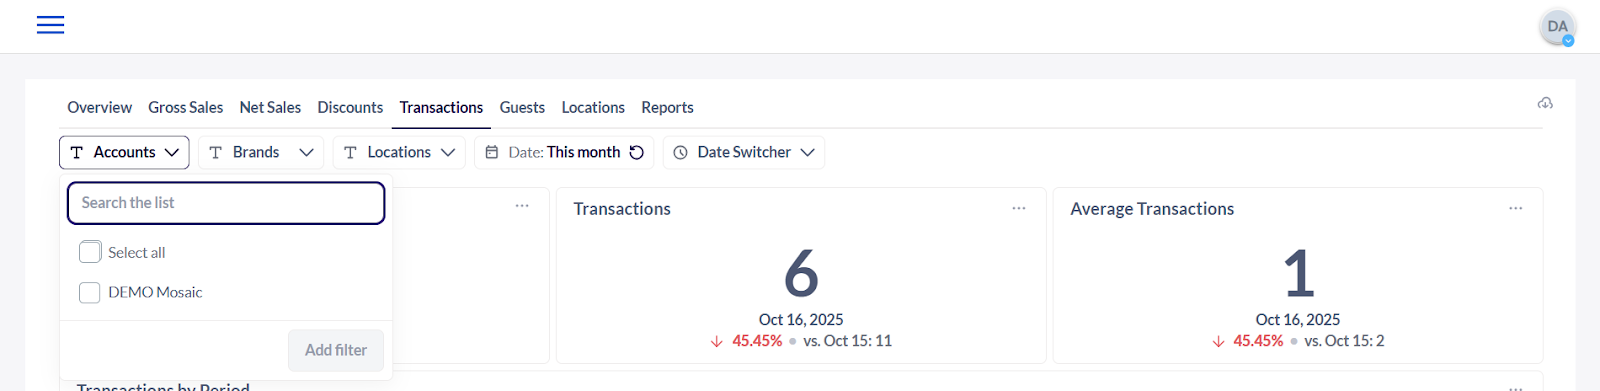
- The Account Filter lets you select the Account Name that is registered with Mosaic.
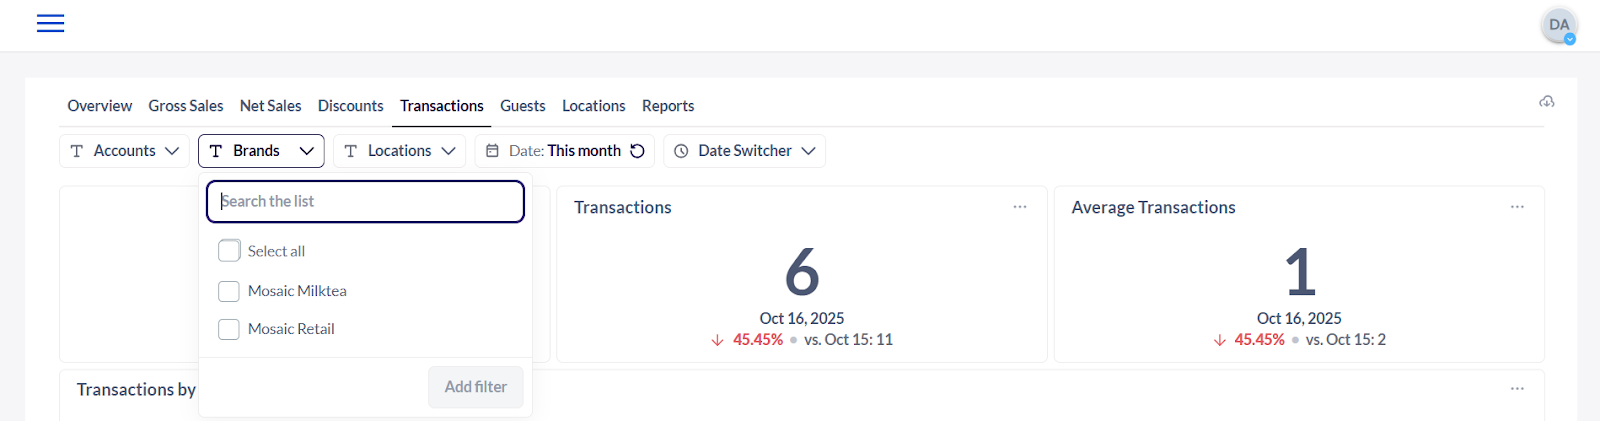
- The Brand Filter lets you select the Brand Name that is associated with the registered account name.
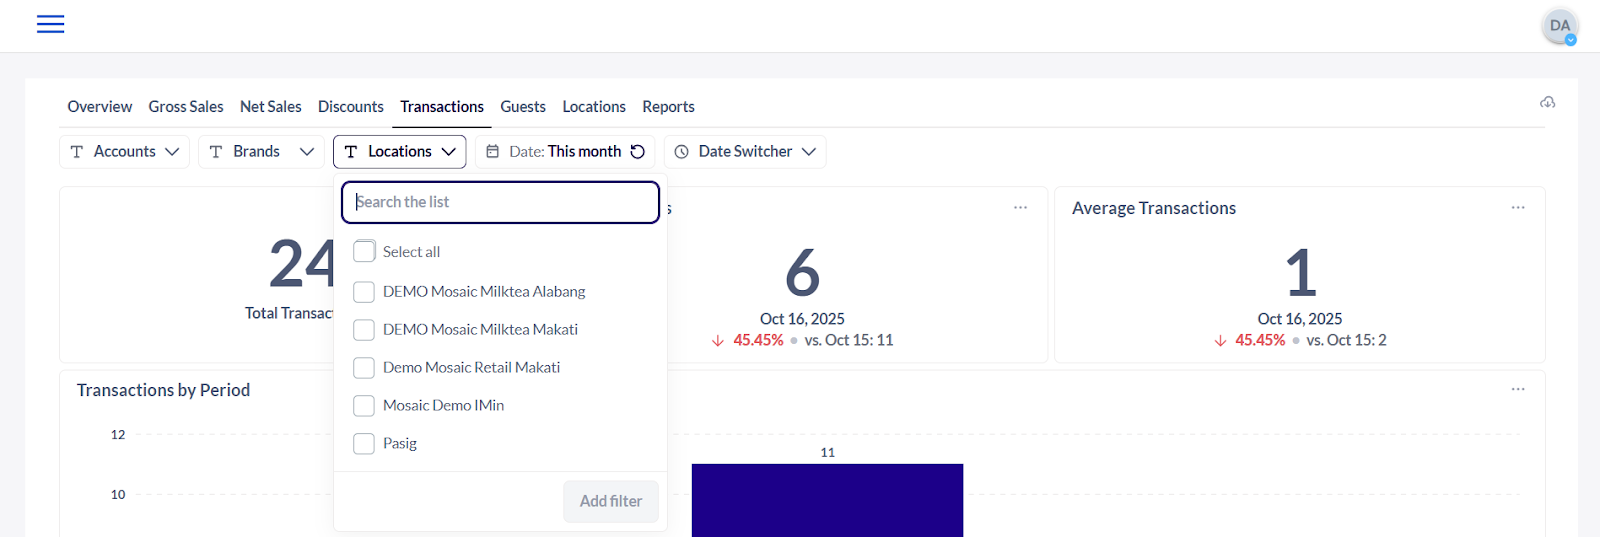
- The Location Filter shows you the date from the selected branch/location.
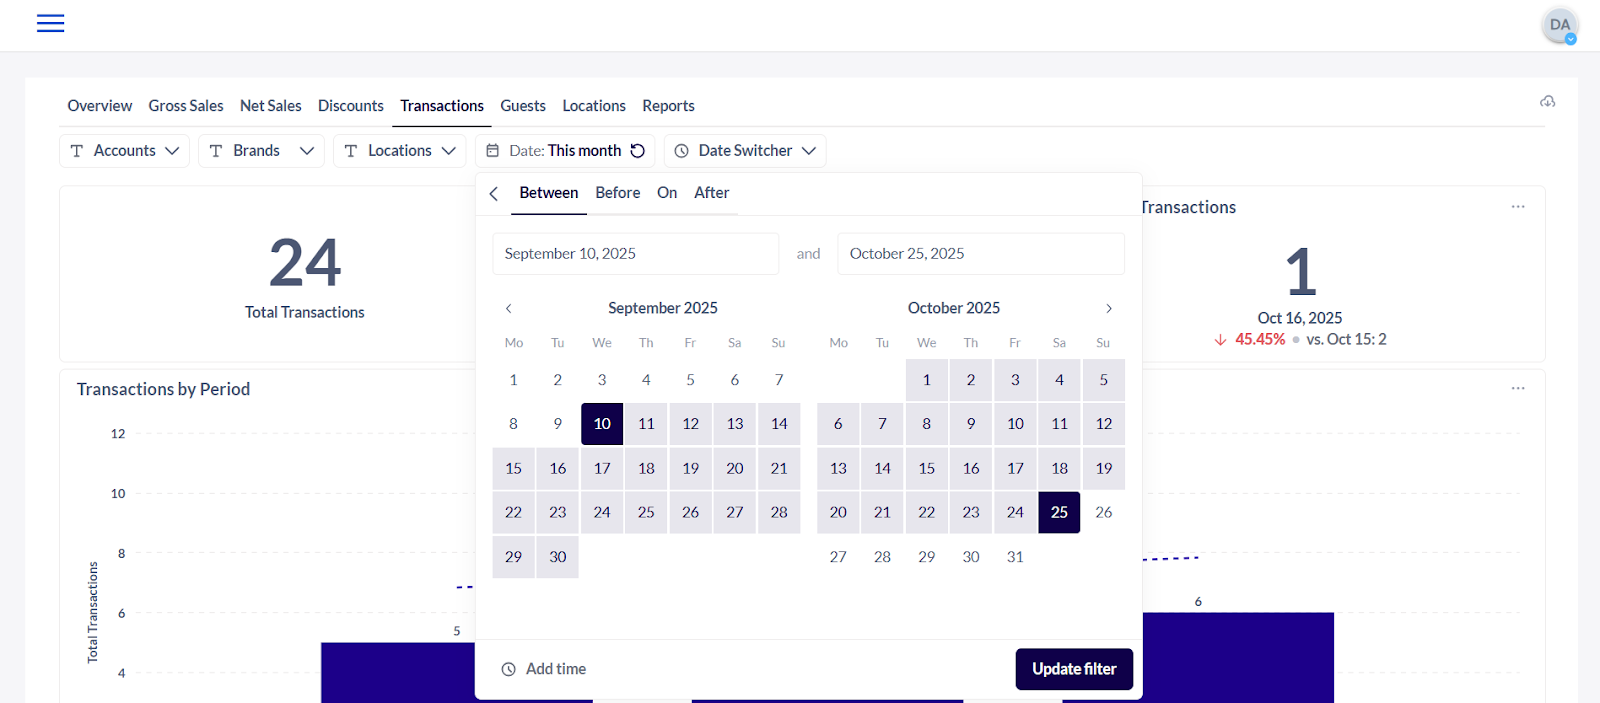
- The Date Filter lets you adjust the date range of the data that the user would like to generate.
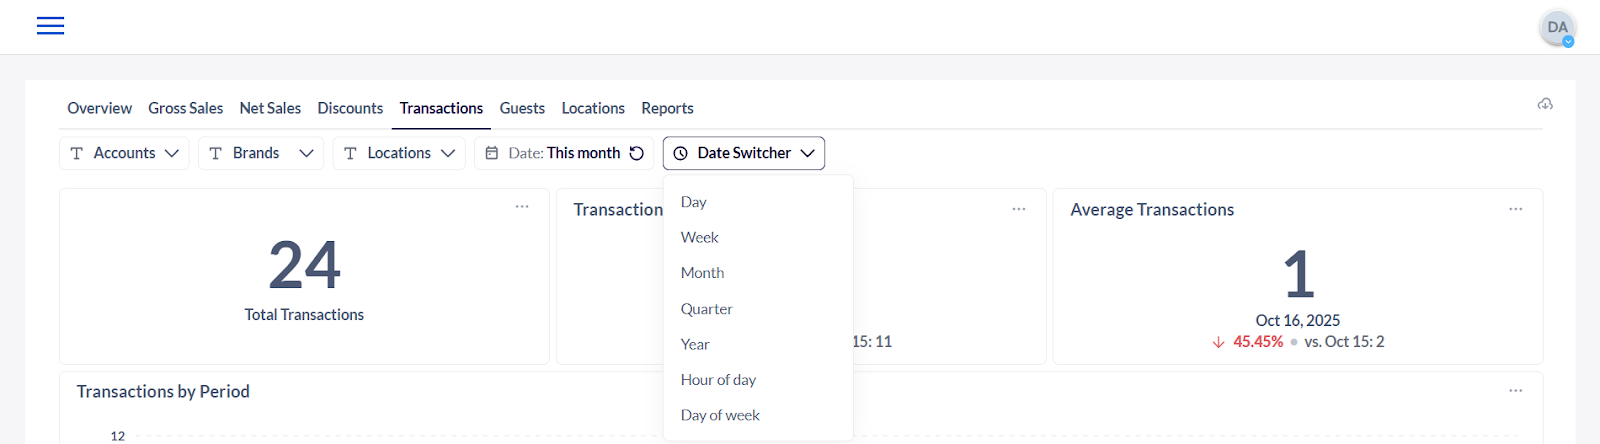
- The Data Switcher Filter lets you select which frequency or timeline you would like to view the data.
- Total Transactions - The overall number of sales or purchase activities within the selected date range.
- Transactions - Each individual customer order or check handled by the restaurant.
- Average Transactions - The average number of orders or bills per day, shift, or another time frame in the restaurant.

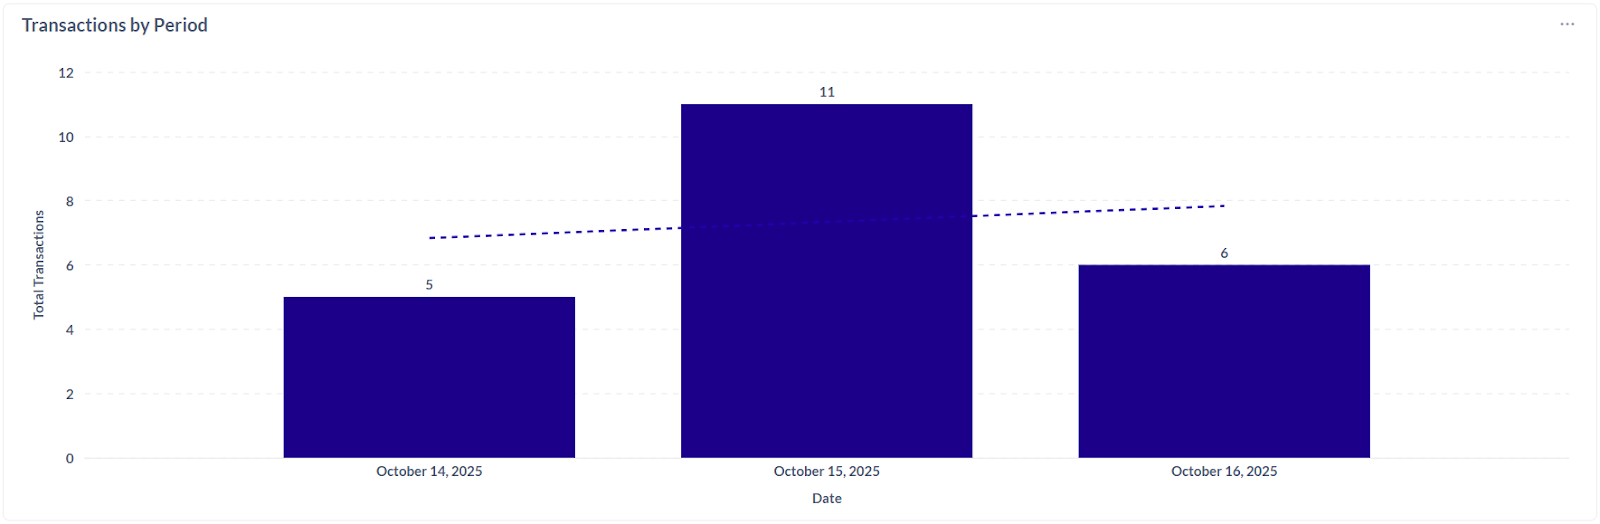
- Transactions by Period - The number or value of customer orders recorded during a specific time frame (day, week, or month).
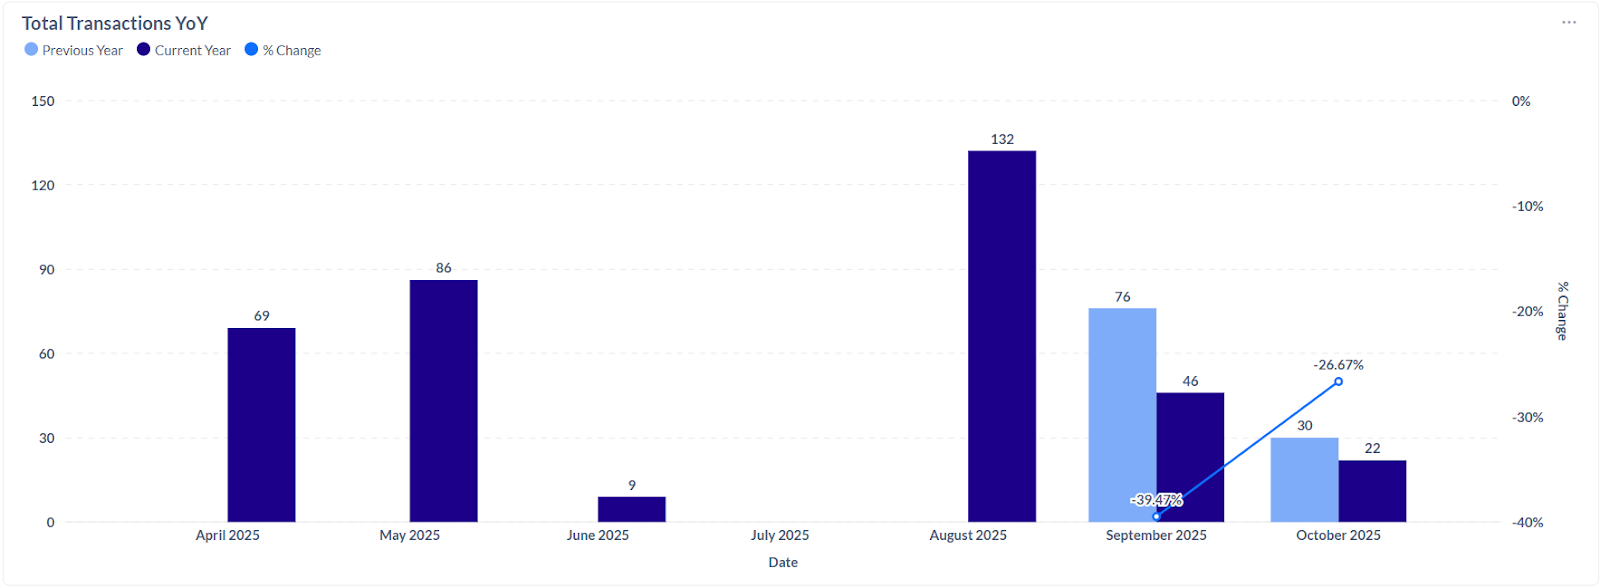
- Total Transactions (YoY) - The total number of customer orders or bills compared year over year.
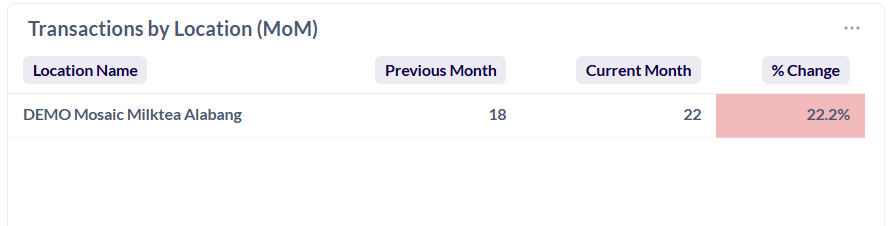
- Transactions by Location (MoM) - The month-over-month comparison of the number of transactions at each restaurant location.
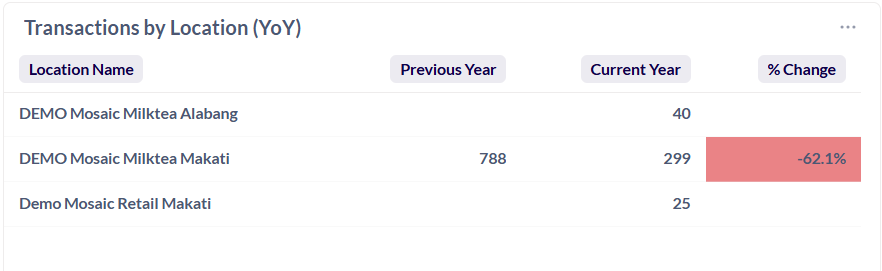
- Transactions by Location (YoY) - The year-over-year comparison of the number of transactions at each restaurant location.
Note: The tables and data may be downloaded by selecting the options icon (3-dots) at the top right corner of each window.