- Go to https://backoffice-console.mosaic-pos.com/#/auth/login
- Log in to the Mosaic Analytics using your account.
- Click “Log In”
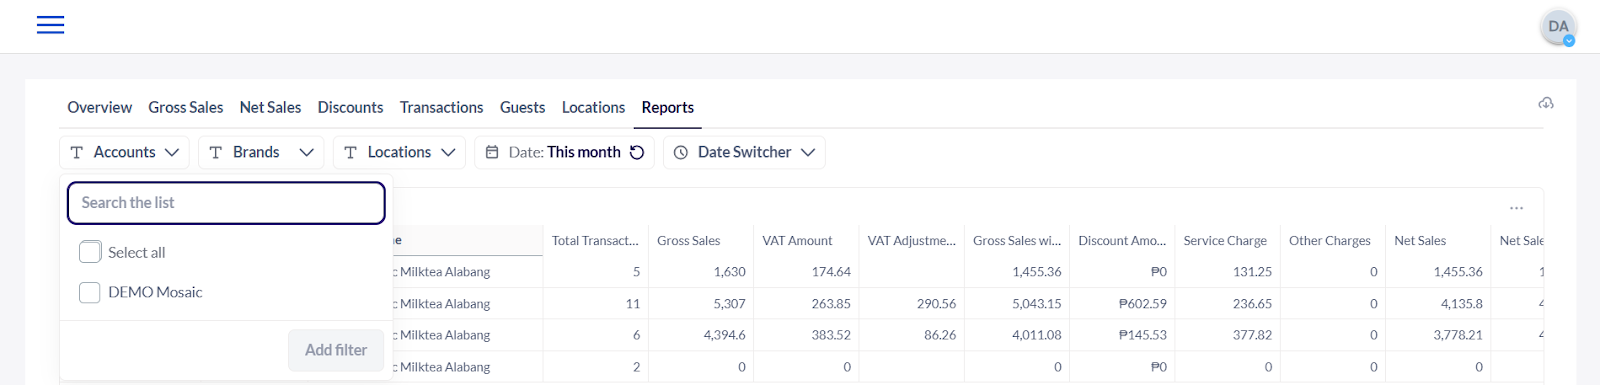
- The Account Filter lets you select the Account Name that is registered with Mosaic.
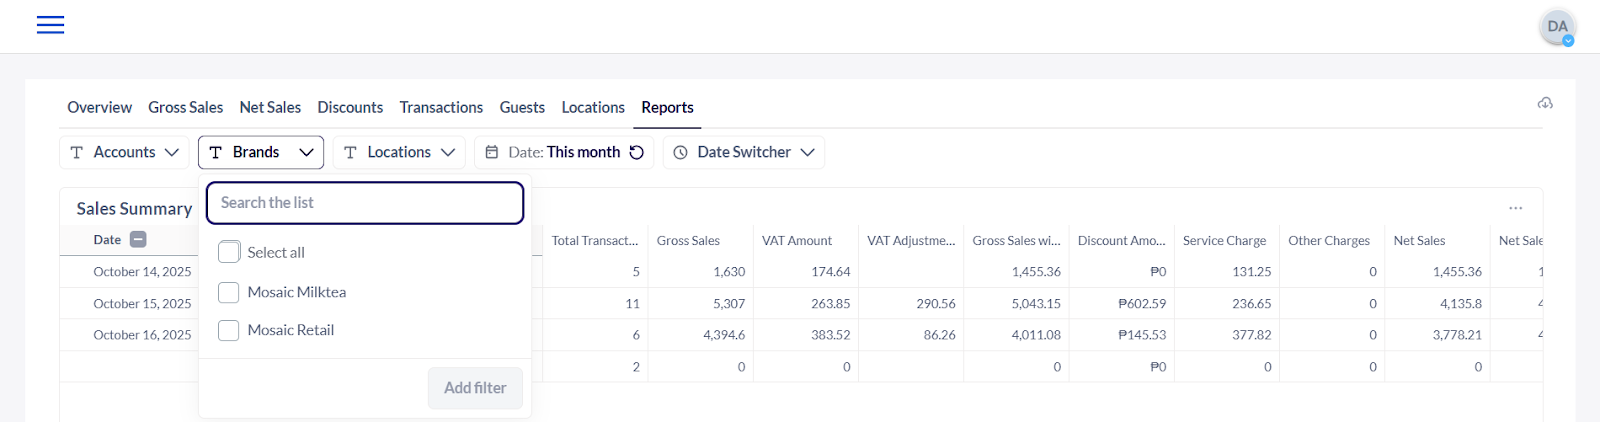
5. The Brand Filter lets you select the Brand Name that is associated with the registered account name.
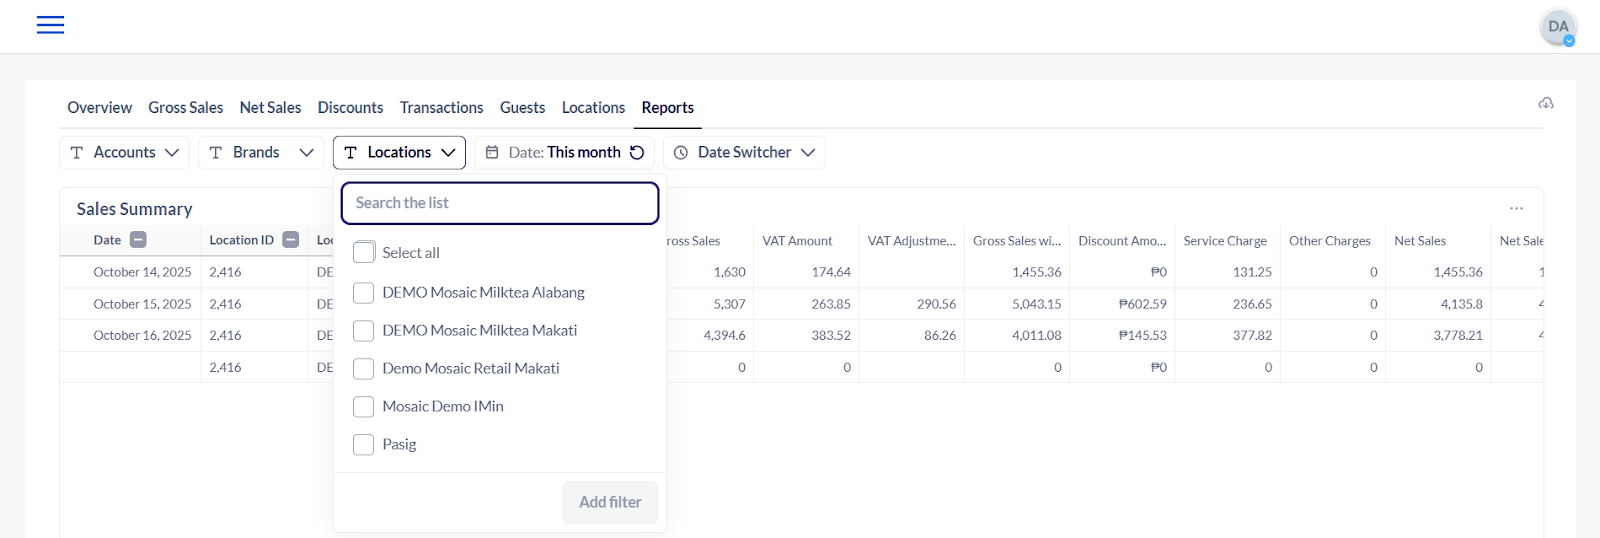
6. The Location Filter shows you the date from the selected branch/location.
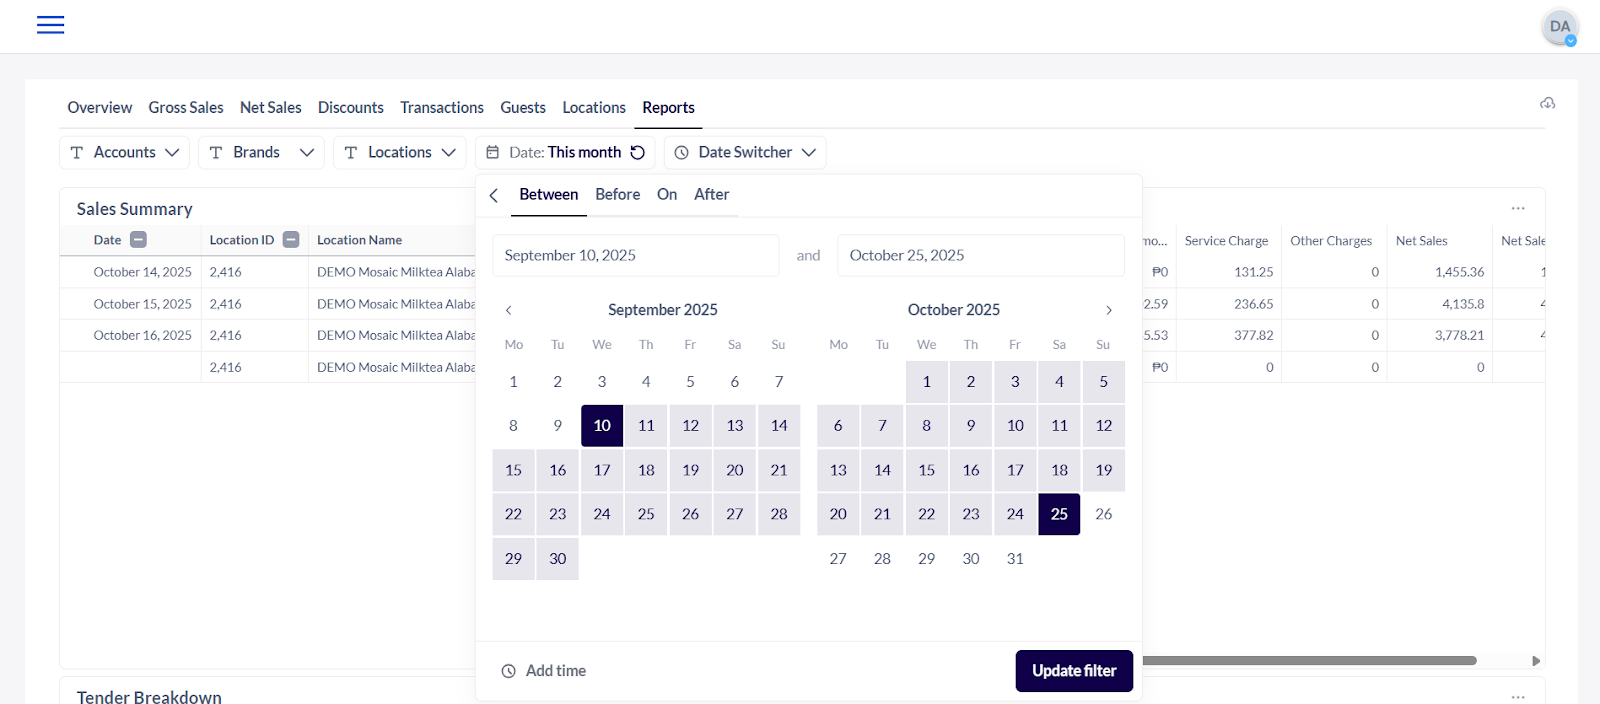
7. The Date Filter lets you adjust the date range of the data that the user would like to generate.
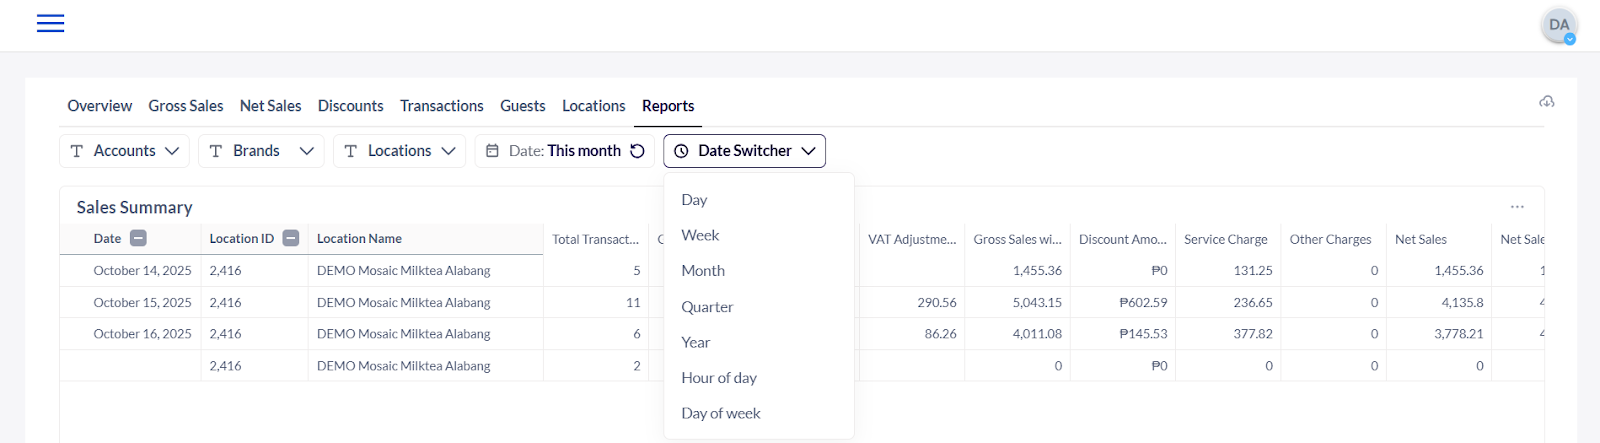
8. The Date Switcher Filter lets you select which frequency or timeline you would like to view the data.
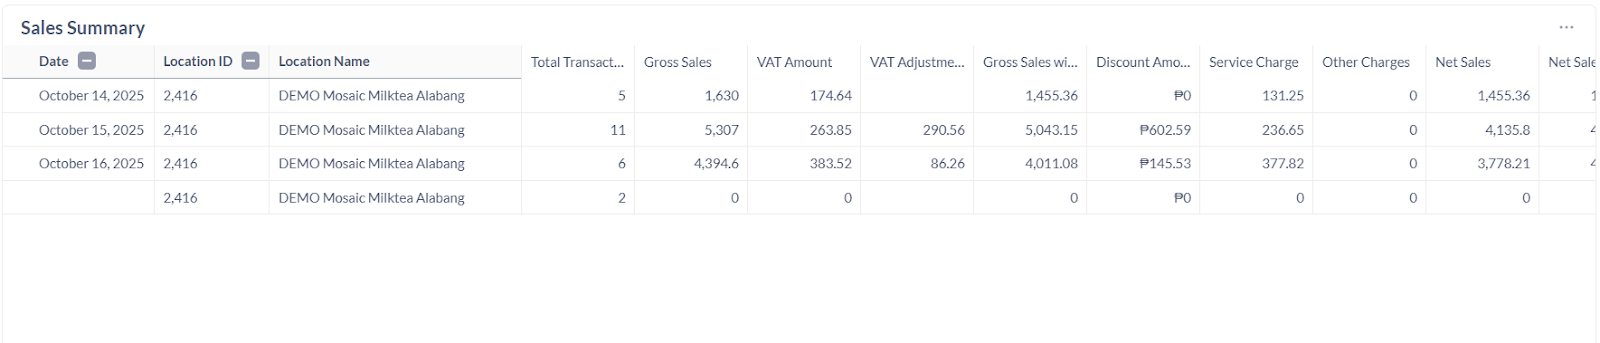
9. Sales Summary - A snapshot of a business’s sales performance over a period, showing key metrics like gross sales, net sales, total transactions, and average spend per guest. It helps track revenue trends and compare performance across locations, brands, or time periods.
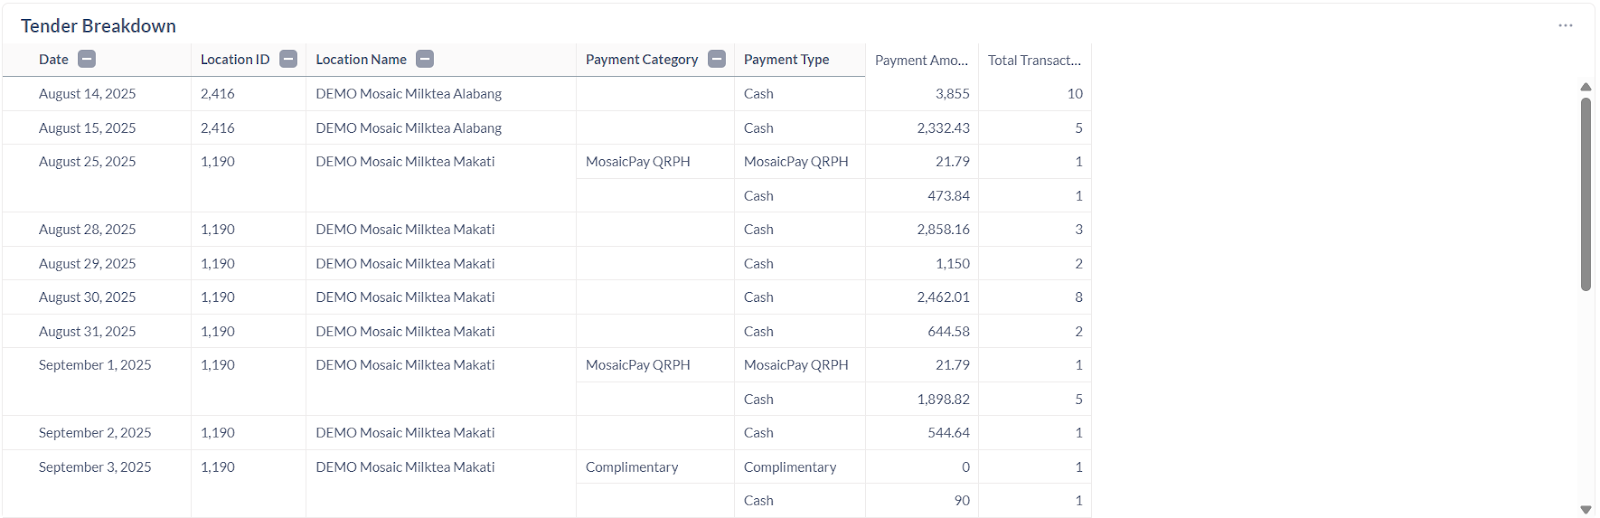
10. Tender Breakdown - The distribution of payments by type (Cash, MosaicPay, GCash, etc.) for transactions over a specific period tracking how customers are paying and manage cash flow and reconciliation.
11. Transaction Summary - An overview of all sales transactions over a specific period, including total transactions, total sales, discounts applied, and net sales tracking sales activity, performance trends, and operational efficiency.
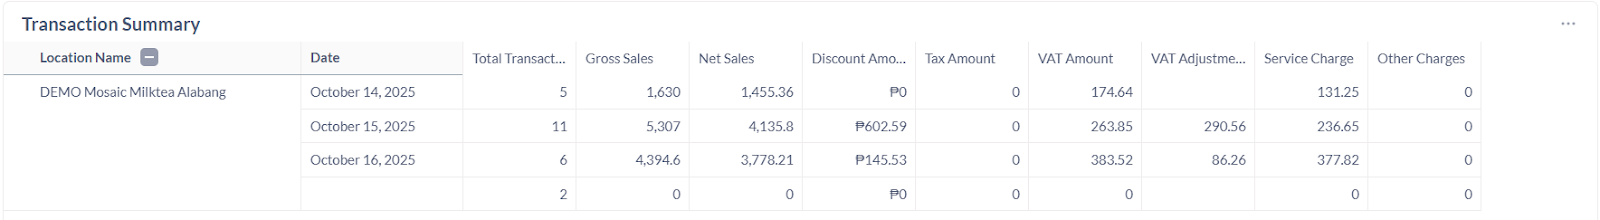
Note: The tables and data may be downloaded by selecting the options icon (3-dots) at the top right corner of each window.