- Go to https://backoffice-console.mosaic-pos.com/#/auth/login
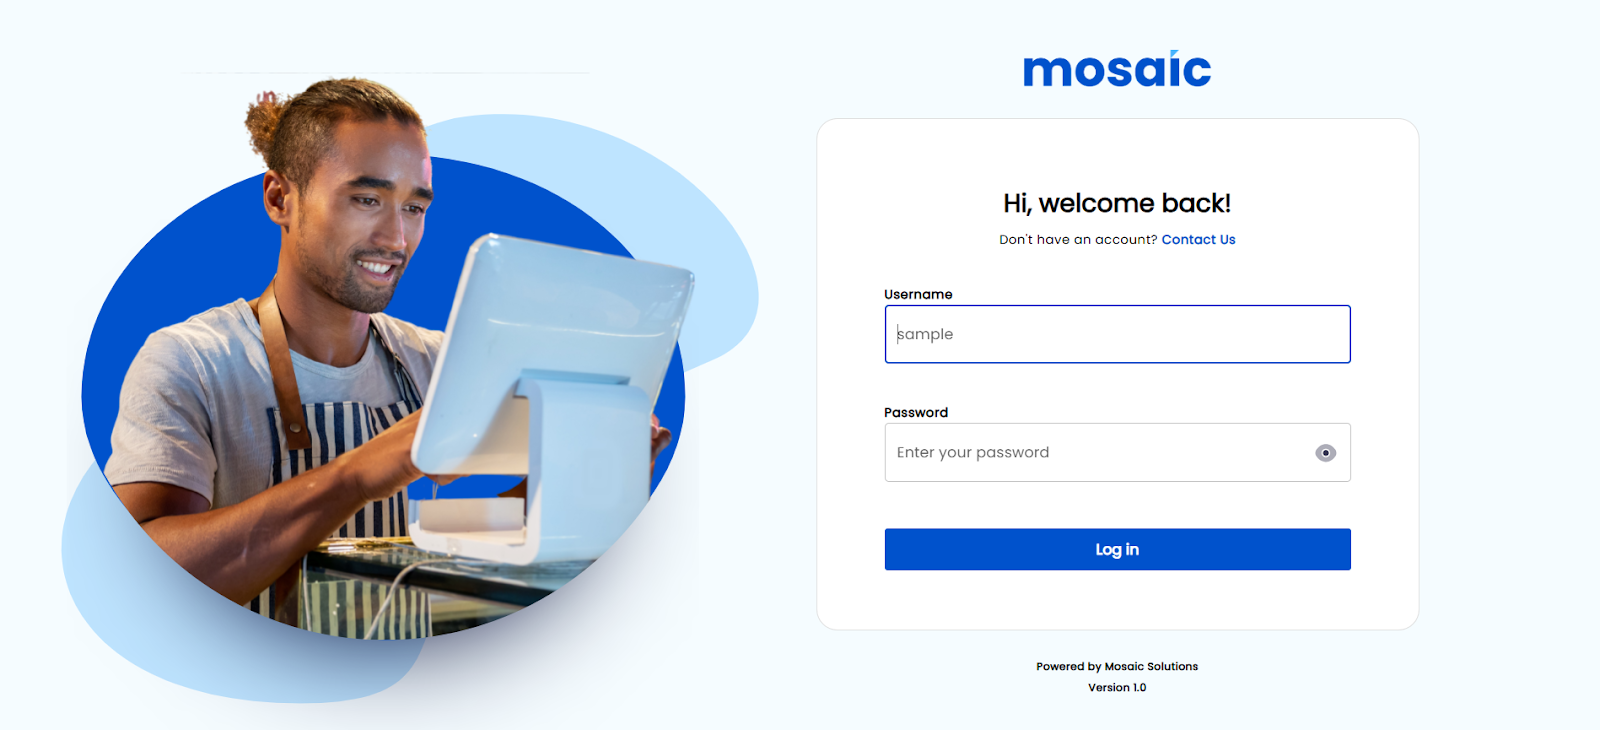
- Log in to the Mosaic Analytics using your account.
- Click “Log In”
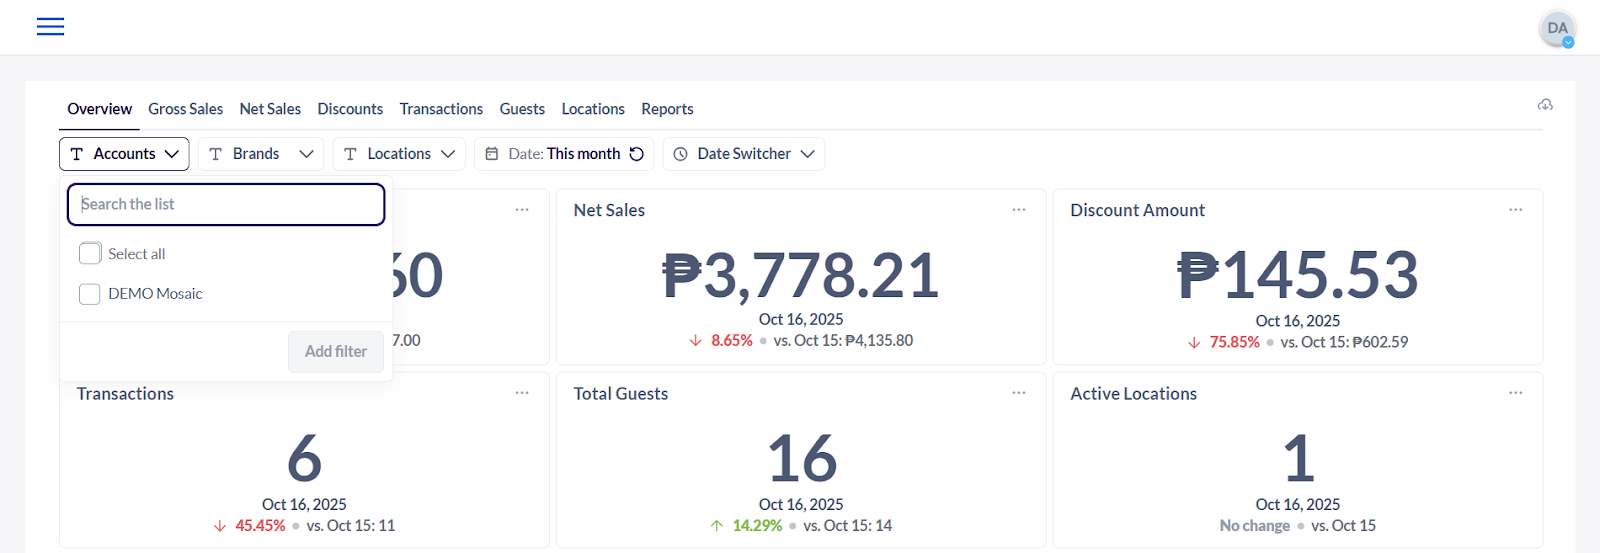
- The Account Filter lets you select the Account Name that is registered with Mosaic.
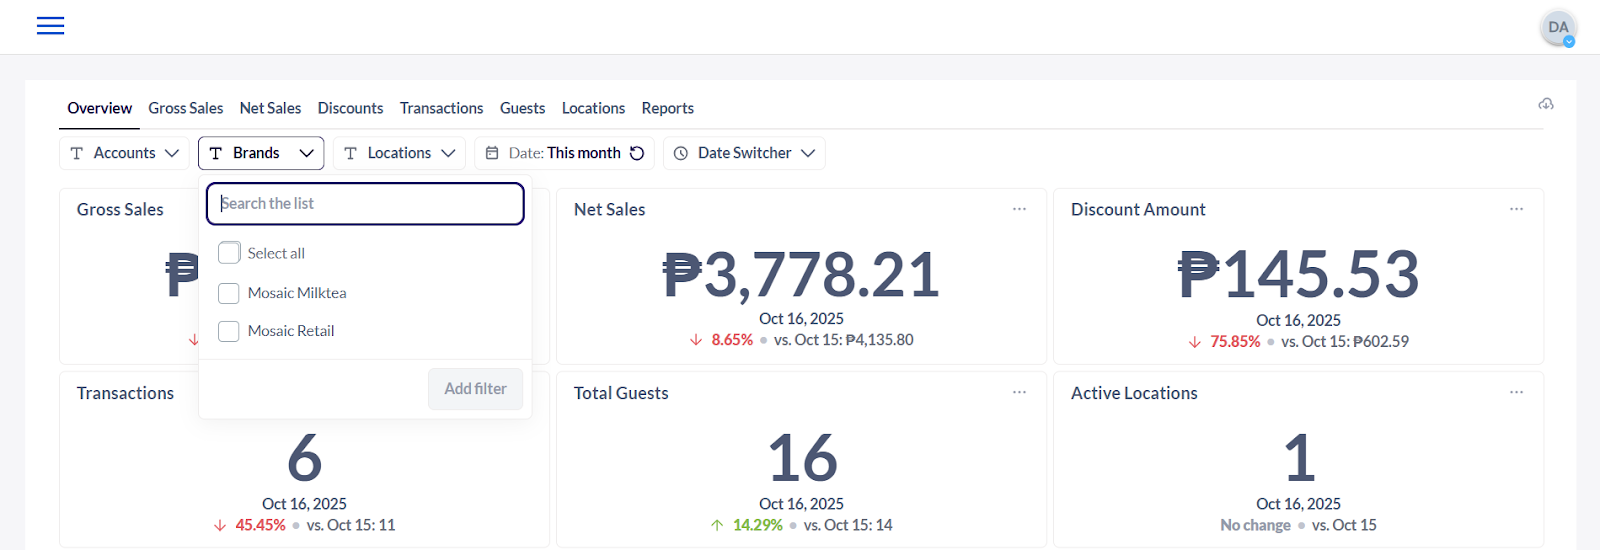
- The Brand Filter lets you select the Brand Name that is associated with the registered account name.
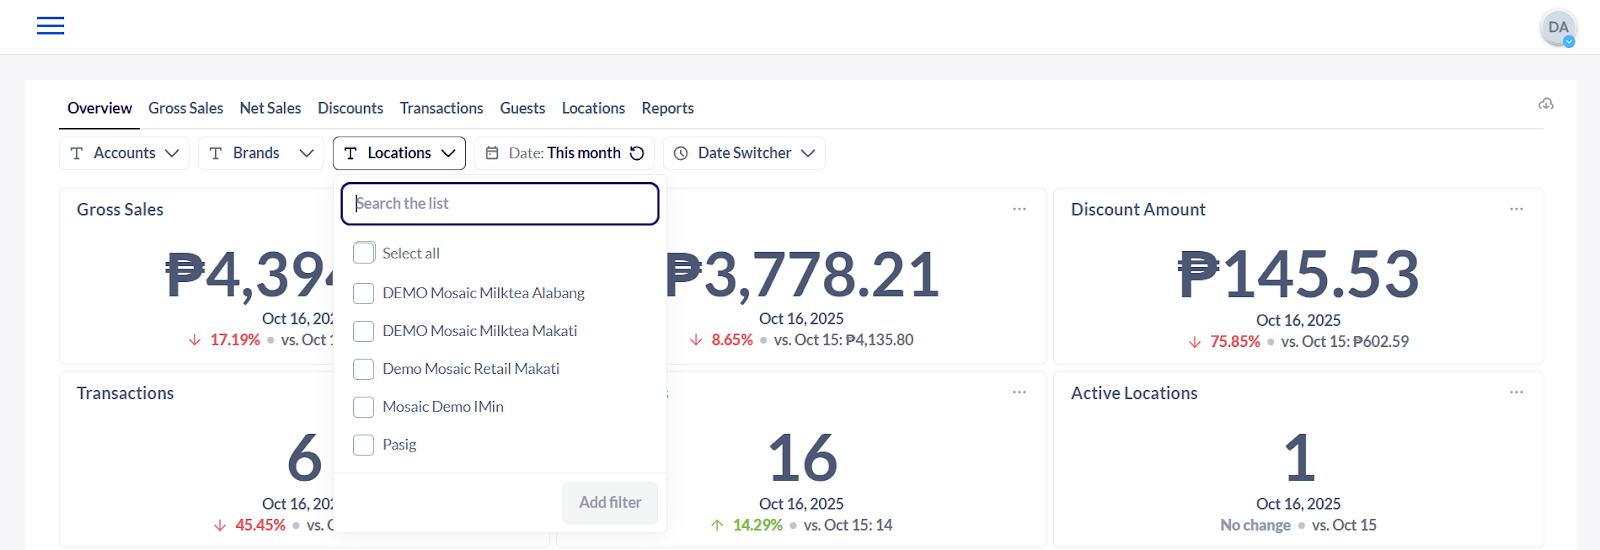
- The Location Filter shows you the date from the selected branch/location.
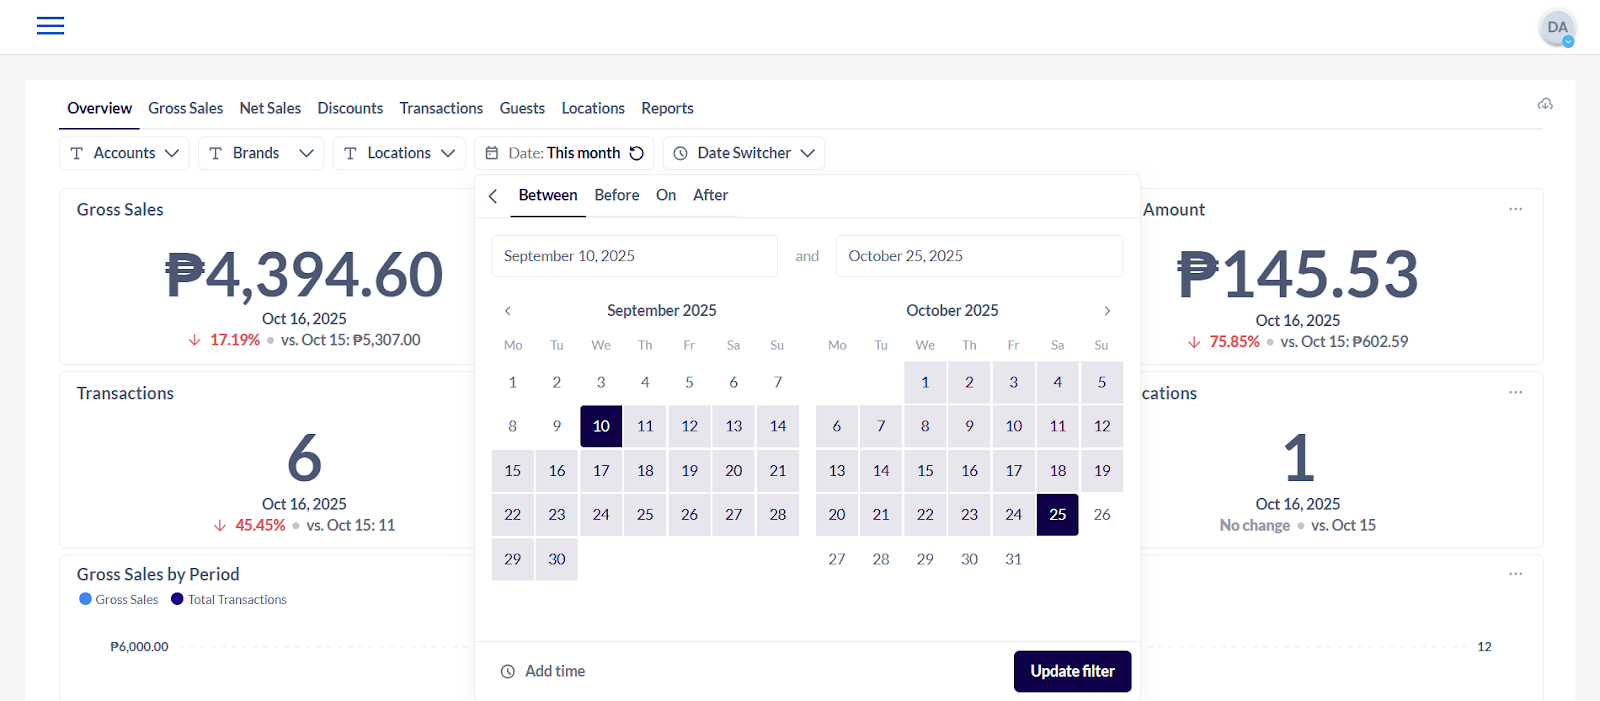
- The Date Filter lets you adjust the date range of the data that the user would like to generate.
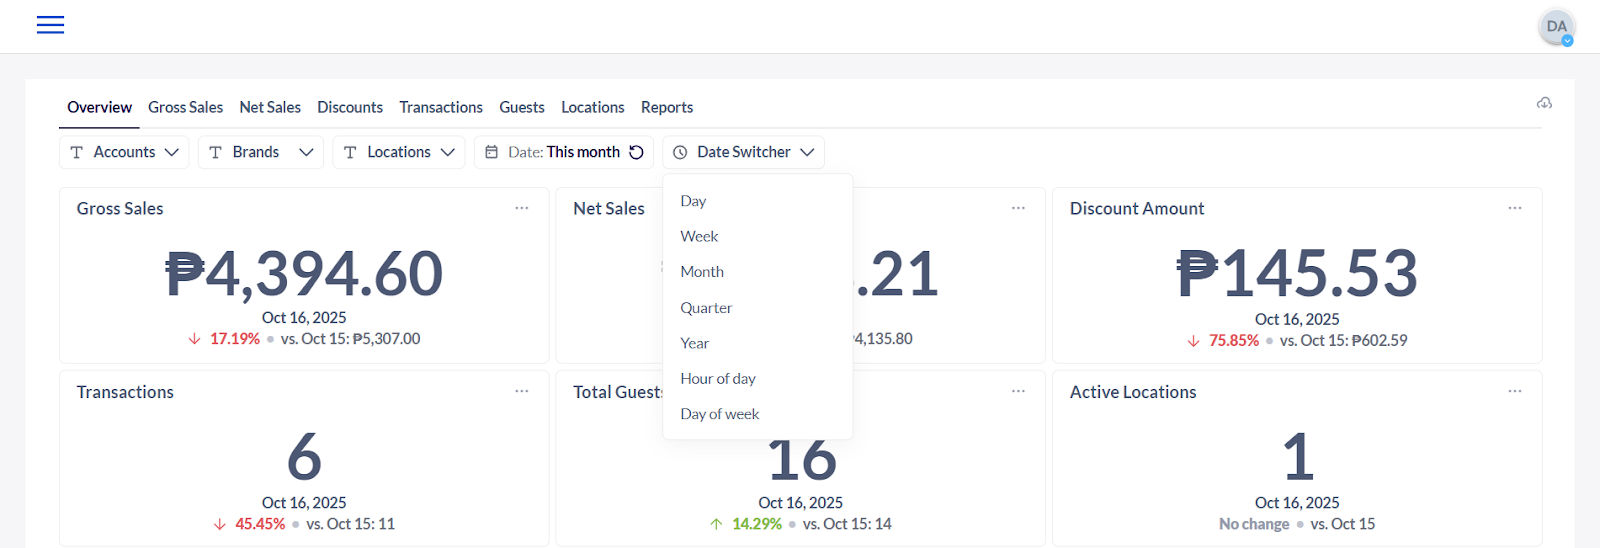
- The Data Switcher Filter lets you select which frequency or timeline you would like to view the data.
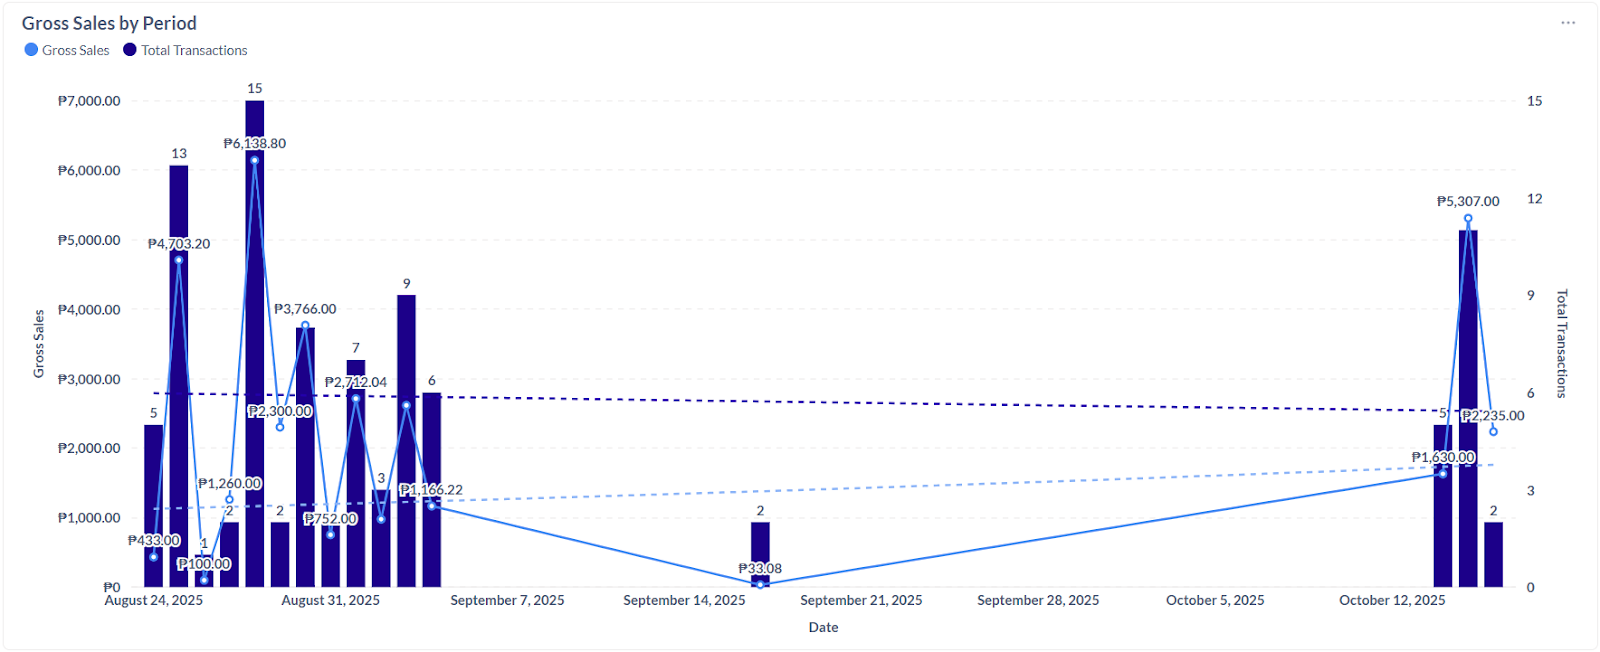
- Gross Sales by Period - the total, raw monetary value of all sales transactions before deduction of any fees, services, discounts, etc.
- The dark blue bars and the dark blue line with dots (Total Transactions) show how many people bought from the store.
- The light blue line and the dots on it (Gross Sales) show the total money earned—that's how much cash was collected from all the transactions created.
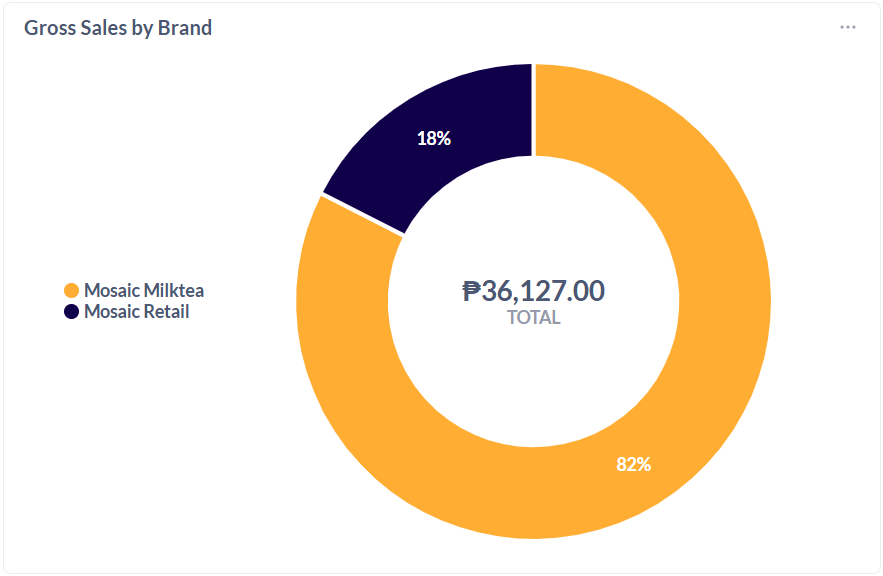
- Gross Sales by Brand - the total, unfiltered sales revenue generated by each individual brand or product line.
- Gross Sales by Location - the total, unadjusted sales revenue generated by one specific physical store or business location.

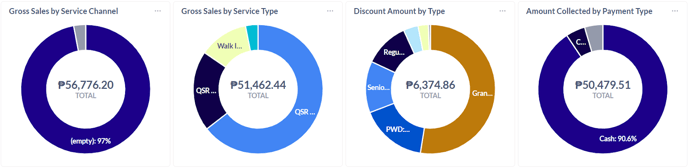
- Gross Sales by Service Channel - the total revenue (gross sales) generated per transaction, broken down by the platform or intermediary that facilitated the sale. Telling you exactly how much money each of your third-party partners (e.g., GrabFood, foodpanda, proprietary app) is generating for your business.
- Gross Sales by Service Type - The total revenue (gross sales) generated, categorized by how the customer received the product. Providing an insight as to which service type contributes to business performance.
- Discount Amount by Type - The total monetary value of discounts provided, categorized by the reason or type of the discount. The total discount amount is subtracted from gross sales to arrive at net sales.
- Amount Collected by Payment Type - The total cash value of payments successfully processed, categorized by the method of payment used by the customer.
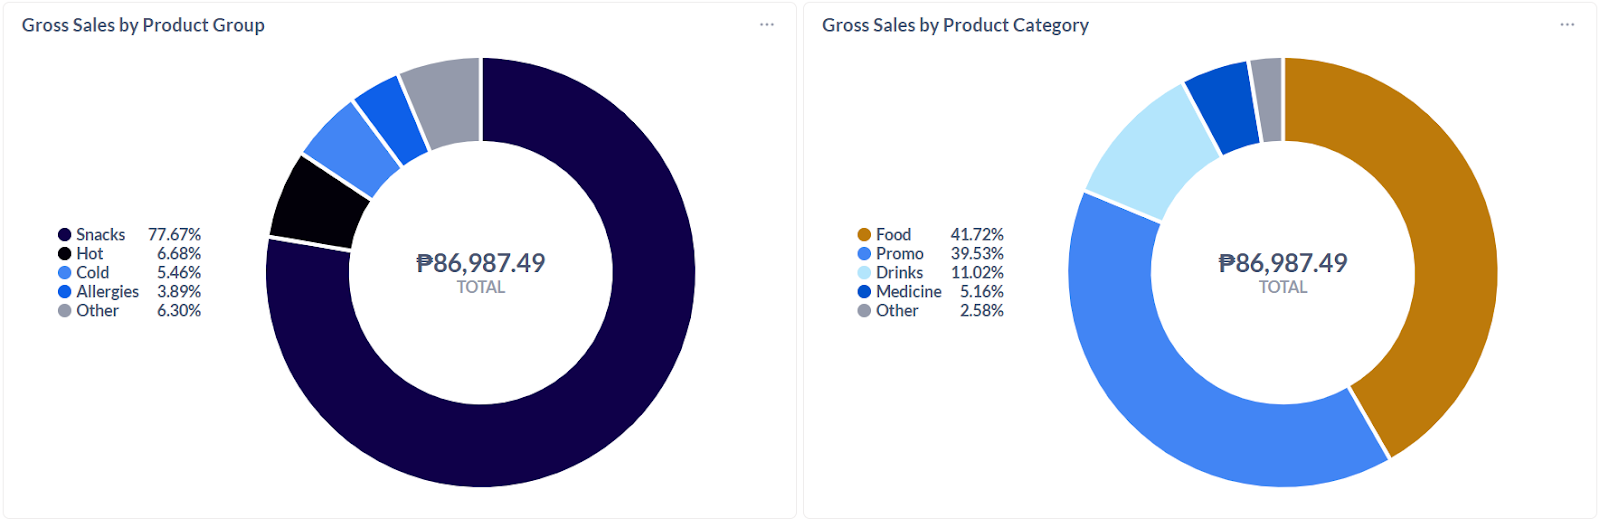
- Gross Sales by Product Group - The high-level classification of your Product Groups as defined in the Mosaic Back Office. This is the primary way to understand what is driving your revenue.
- Gross Sales by Product Category - The high-level classification of your Product Groups as defined in the Mosaic Back Office. This is the primary way to understand what is driving your revenue.
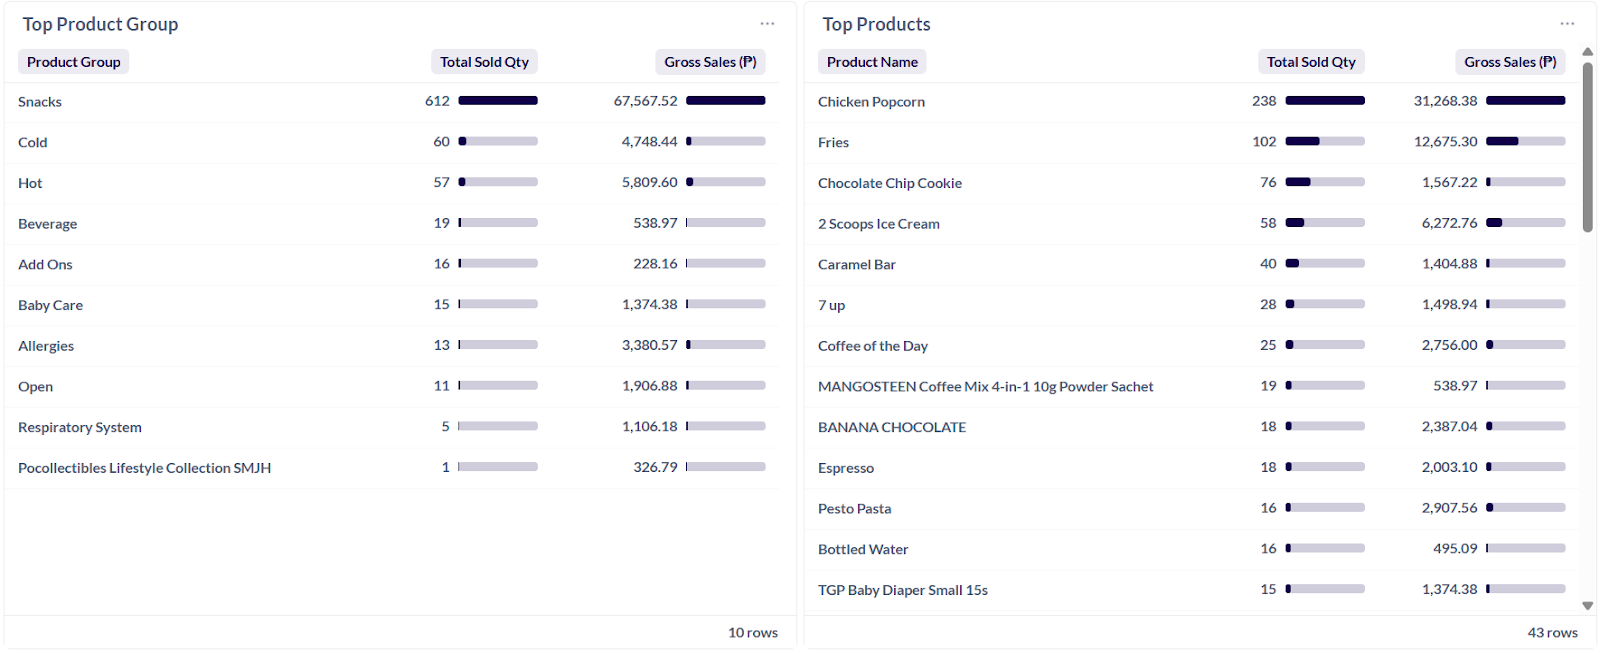
- Top Product by Group - The Product Group that generated the highest total gross sales. Confirming which broad segment is the driver of your company's income.
- Top Products - The individual menu items that generated the highest total gross sales highlighting your top menu items or bestsellers.
Note: The tables and data may be downloaded by selecting the options icon (3-dots) at the top right corner of each window.