- Go to https://backoffice-console.mosaic-pos.com/#/auth/login
- Log in to the Mosaic Analytics using your account.
- Click “Log In”
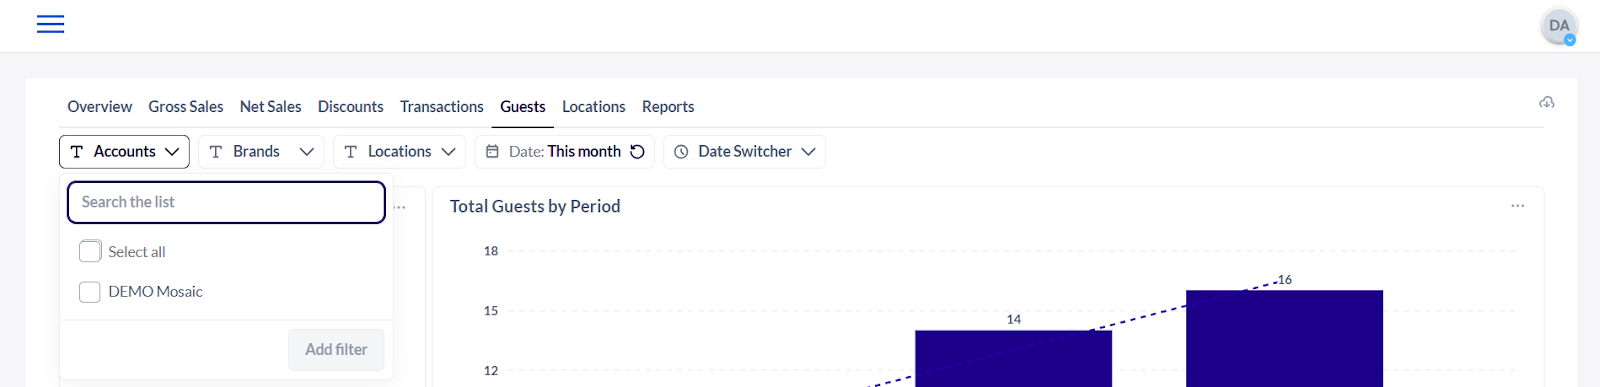
- The Account Filter lets you select the Account Name that is registered with Mosaic.
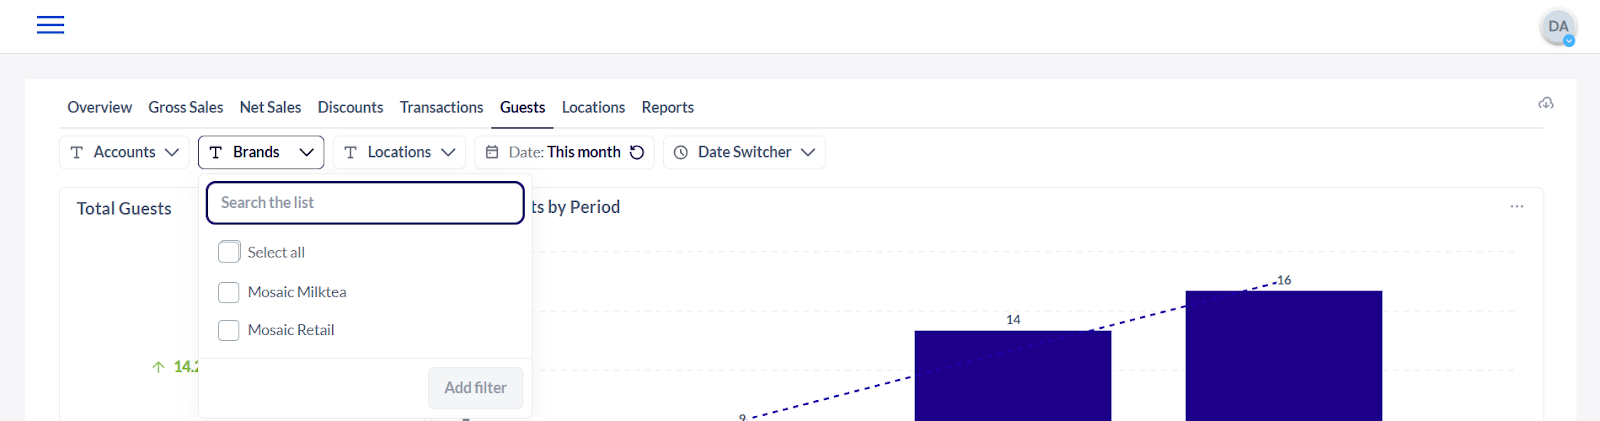
5. The Brand Filter lets you select the Brand Name that is associated with the registered account name.
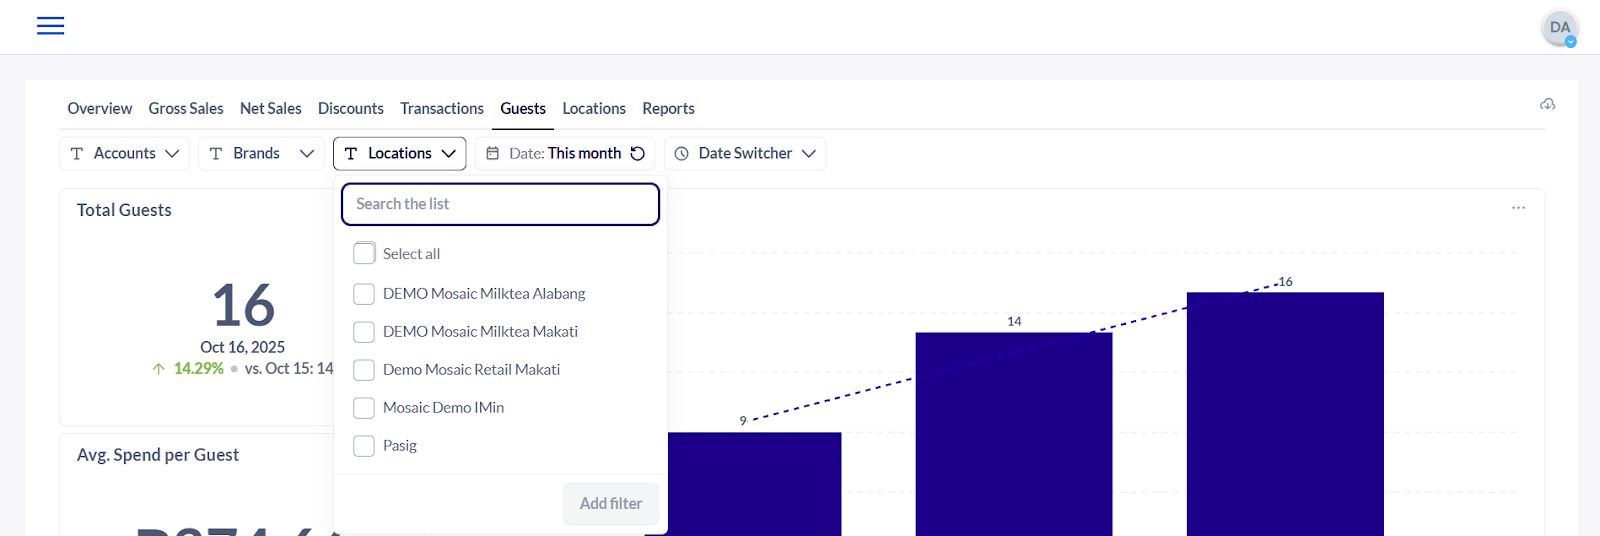
6. The Location Filter shows you the date from the selected branch/location.
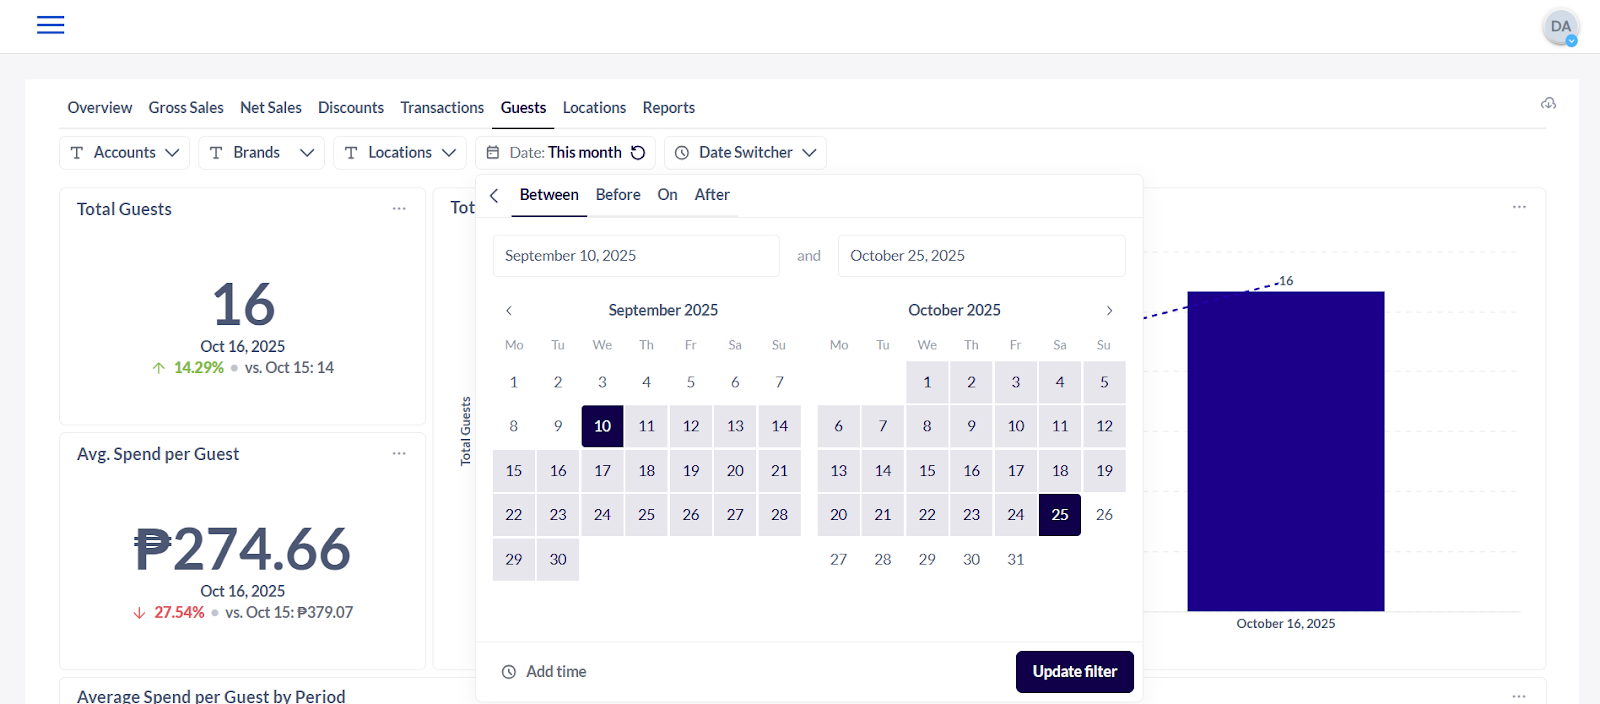
7. The Date Filter lets you adjust the date range of the data that the user would like to generate.
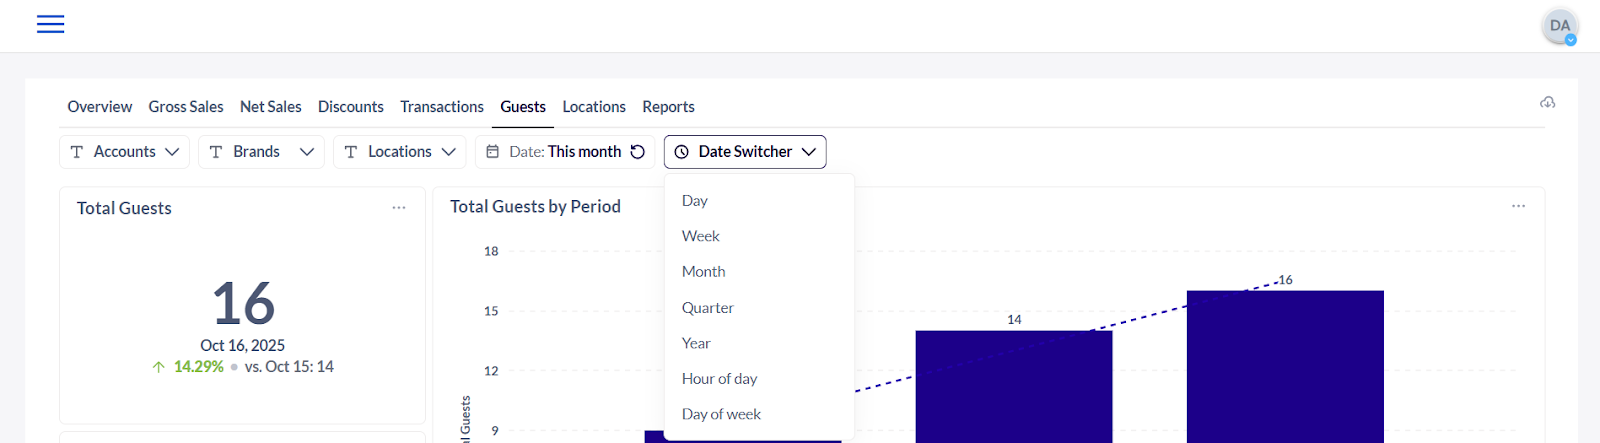
8. The Date Switcher Filter lets you select which frequency or timeline you would like to view the data.
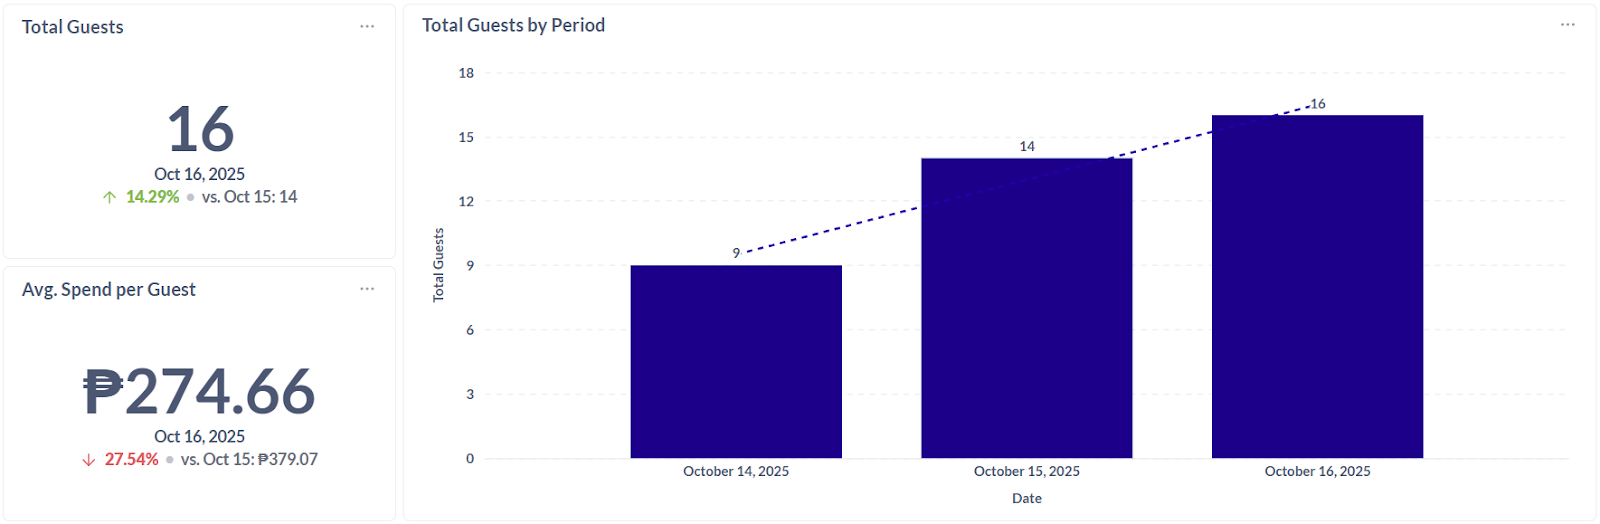
9. Total Guests - The total number of individual customers served during a specific period.
10. Average Spend per Guest - The average amount of money each guest spends.
11. Total Guests by Period - The number of guests served during a specific time frame (day, week, month), useful for tracking trends and peak times.
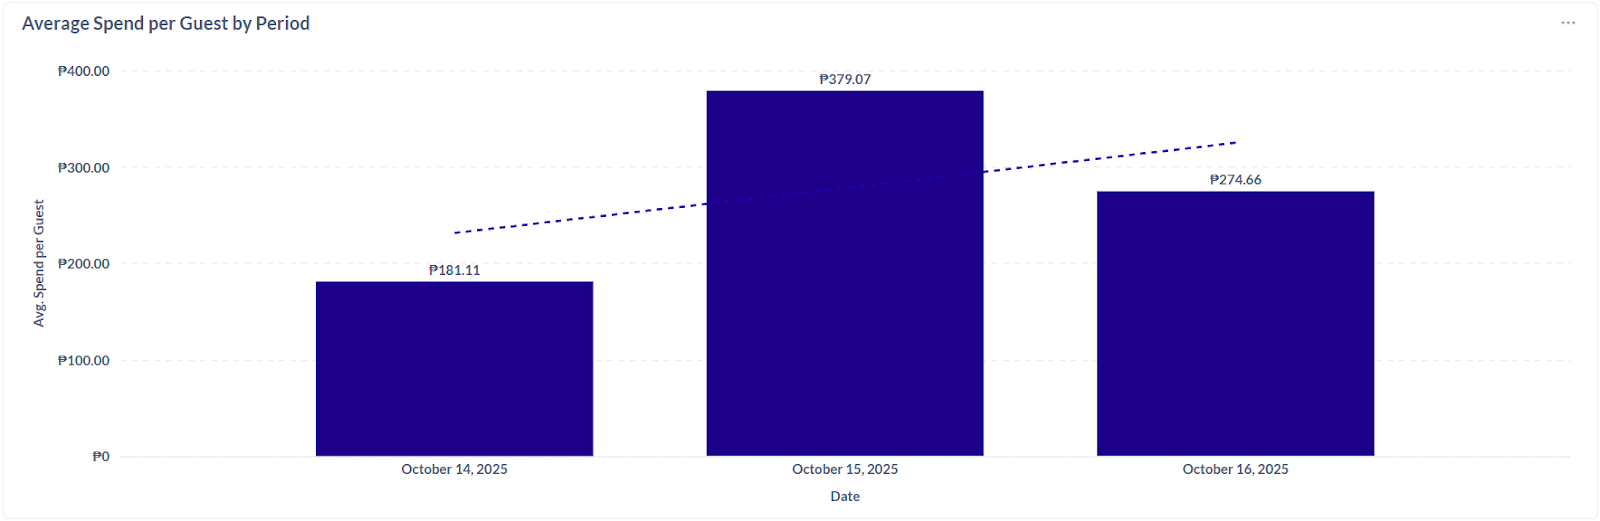
12. Average Spend per Guest by Period - The average amount each customer spends during a specific time frame (day, week, month, etc.) that helps track spending trends over time and evaluate the effectiveness of promotions or menu pricing.
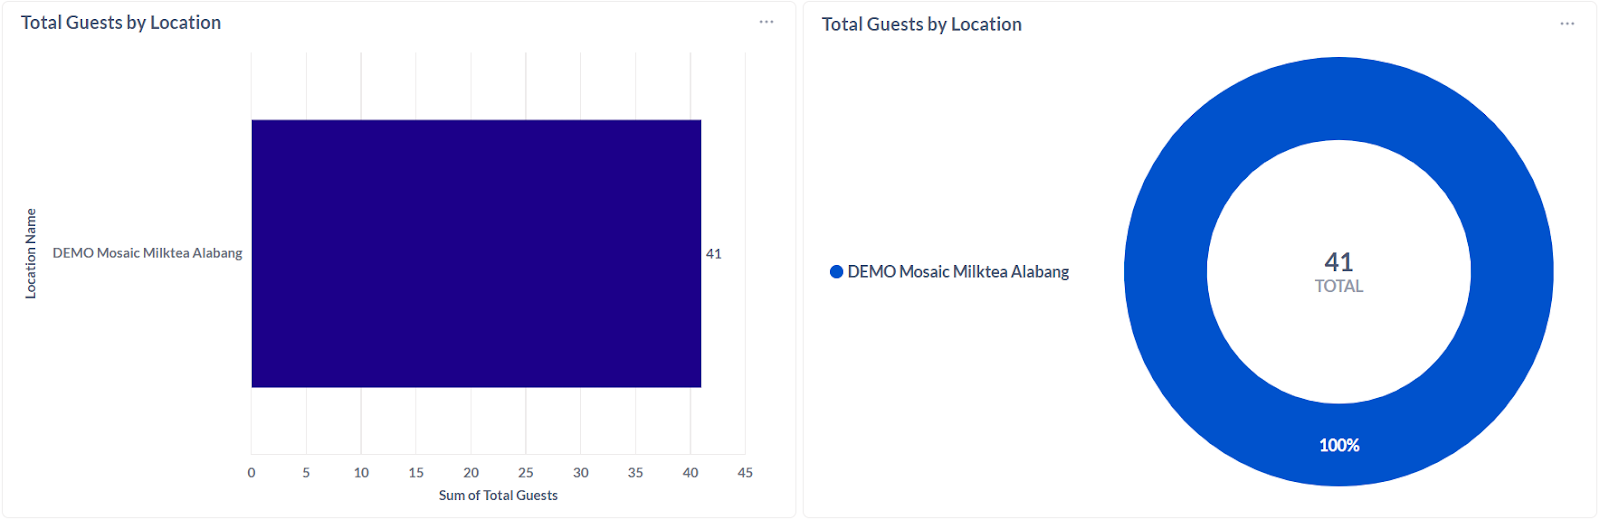
13. Total Guests by Location - The number of individual customers served at each store location during a specific period identifying high-traffic locations, comparing performance across branches, and guide staffing or inventory decisions.
Note: The tables and data may be downloaded by selecting the options icon (3-dots) at the top right corner of each window.