- Go to https://backoffice-console.mosaic-pos.com/#/auth/login

- Log in to the Mosaic Analytics using your account.
- Click “Log In”
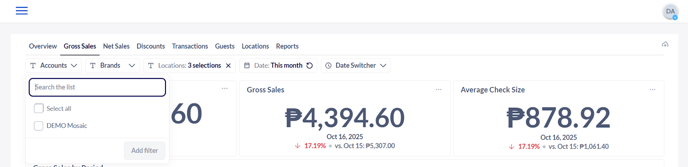
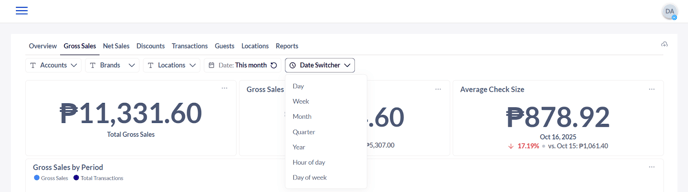
- The Account Filter lets you select the Account Name that is registered with Mosaic.
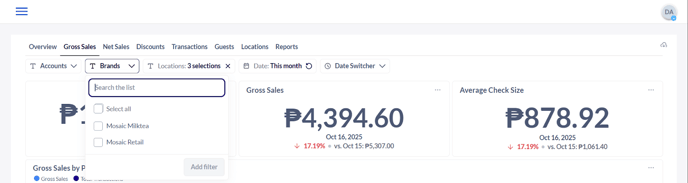
- The Brand Filter lets you select the Brand Name that is associated with the registered account name.
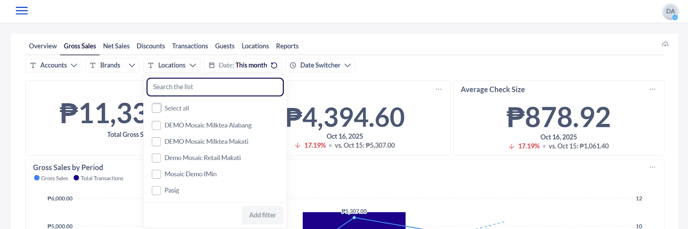
- The Location Filter shows you the date from the selected branch/location.
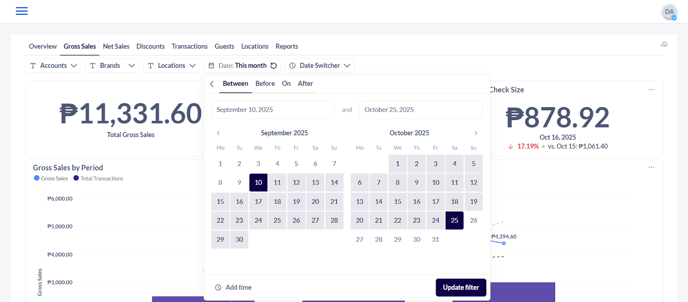
- The Date Filter lets you adjust the date range of the data that the user would like to generate.
- The Data Switcher Filter lets you select which frequency or timeline you would like to view the data.
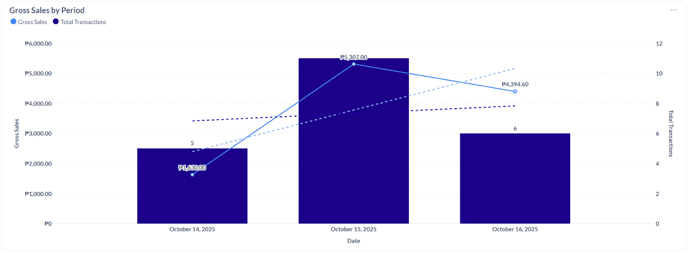
- Gross Sales by Period - the total, raw monetary value of all sales transactions before deduction of any fees, services, discounts, etc.
- The dark blue bars and the dark blue line with dots (Total Transactions) show how many people bought from the store.
- The light blue line and the dots on it (Gross Sales) show the total money earned—that's how much cash was collected from all the transactions created.
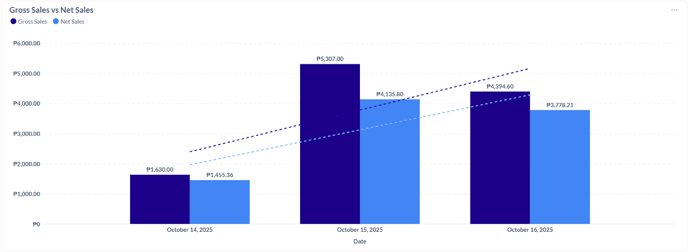
- Gross Sales vs Net Sales - Gross is the total amount of revenue, income, or value before any deductions are subtracted; Net is the final amount that remains after all relevant deductions (like returns, discounts, expenses, or taxes) have been taken out.
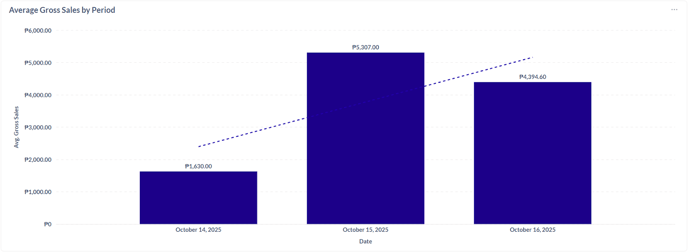
- Average Gross Sales by Period - the total sales revenue a business generates during a specific time frame (day, week, month, quarter, or year) before any deductions like returns, discounts, or allowances.
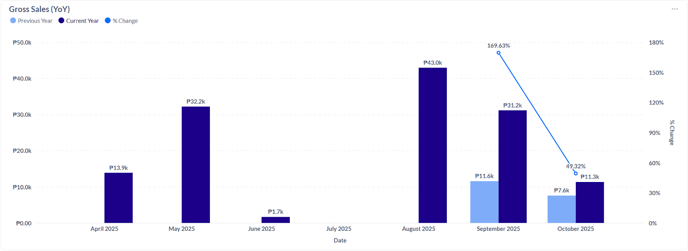
- Gross Sales Year on Year (YoY) - compares total sales from one year to the same period in the previous year. It shows how much sales have increased or decreased annually, helping measure business growth or decline.
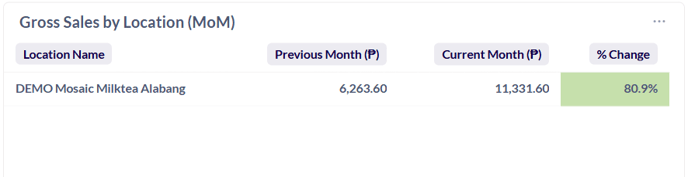
- Gross Sales by Location (MoM) - compares total sales for each location from one month to the previous month. It helps identify which locations are growing, declining, or performing consistently over time.
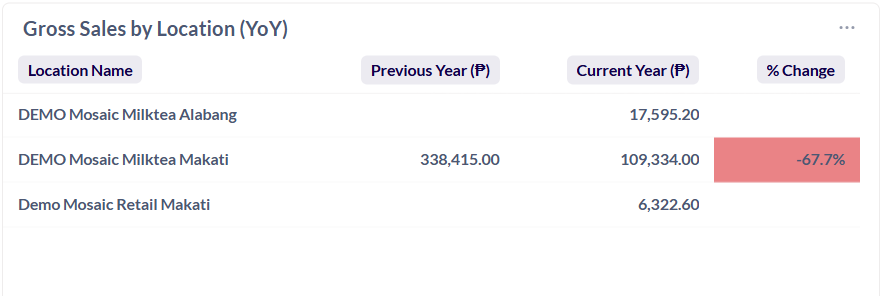
- Gross Sales by Location (YoY) - compares total sales for each location with the same period in the previous year. It highlights annual growth or decline at each location, helping assess long-term performance and regional trends.
Note: The tables and data may be downloaded by selecting the options icon (3-dots) at the top right corner of each window.