- Go to https://backoffice-console.mosaic-pos.com/#/auth/login

- Log in to the Mosaic Analytics using your account.
- Click “Log In”
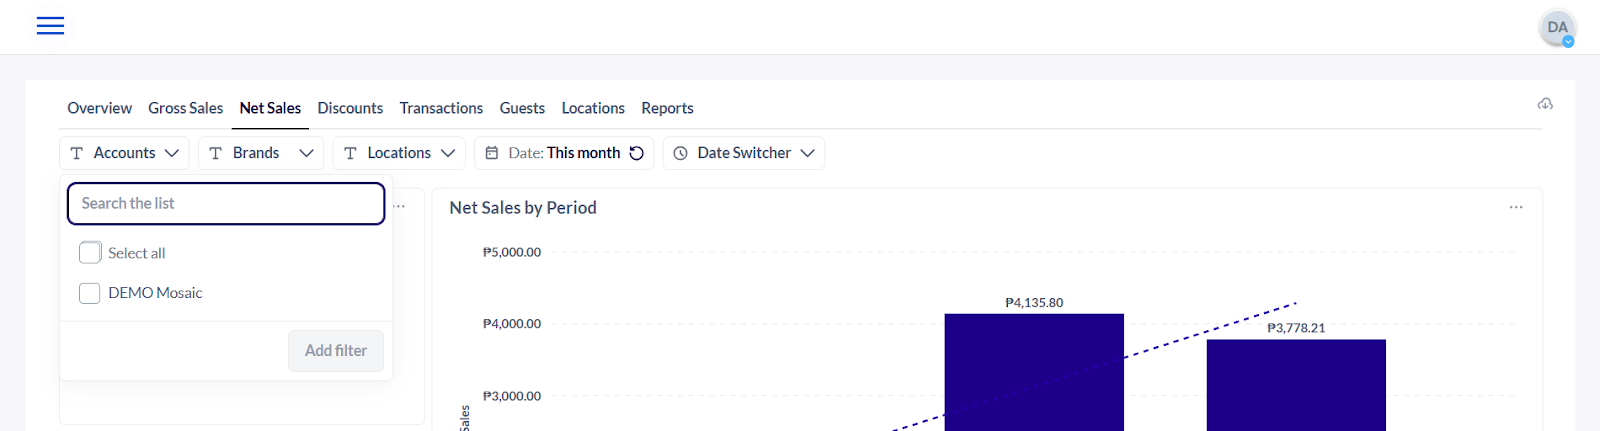
- The Account Filter lets you select the Account Name that is registered with Mosaic.
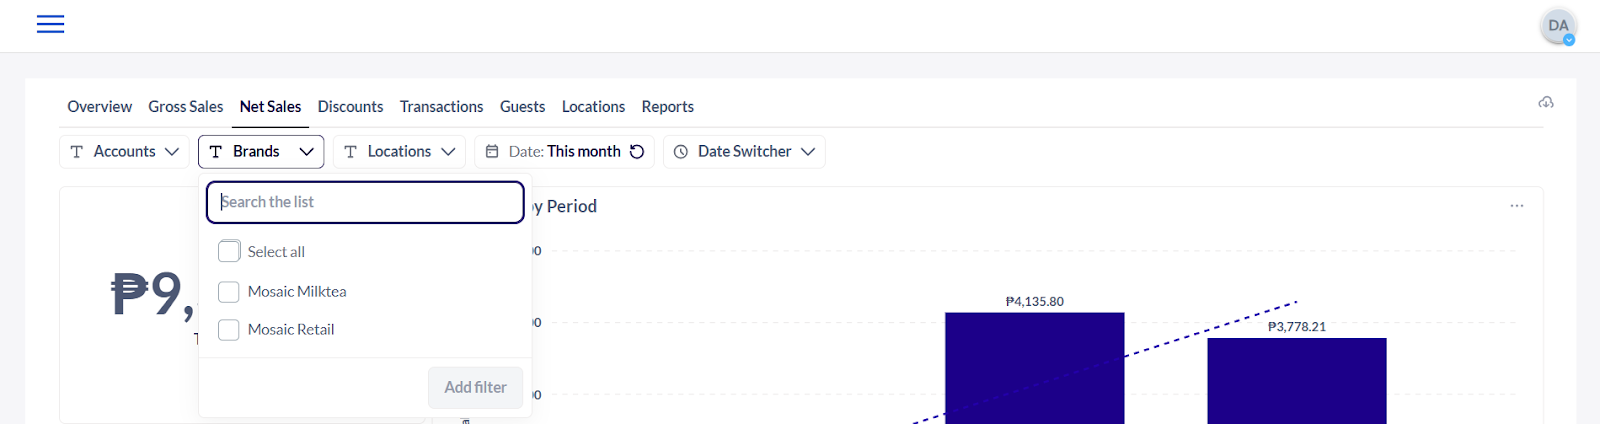
- The Brand Filter lets you select the Brand Name that is associated with the registered account name.
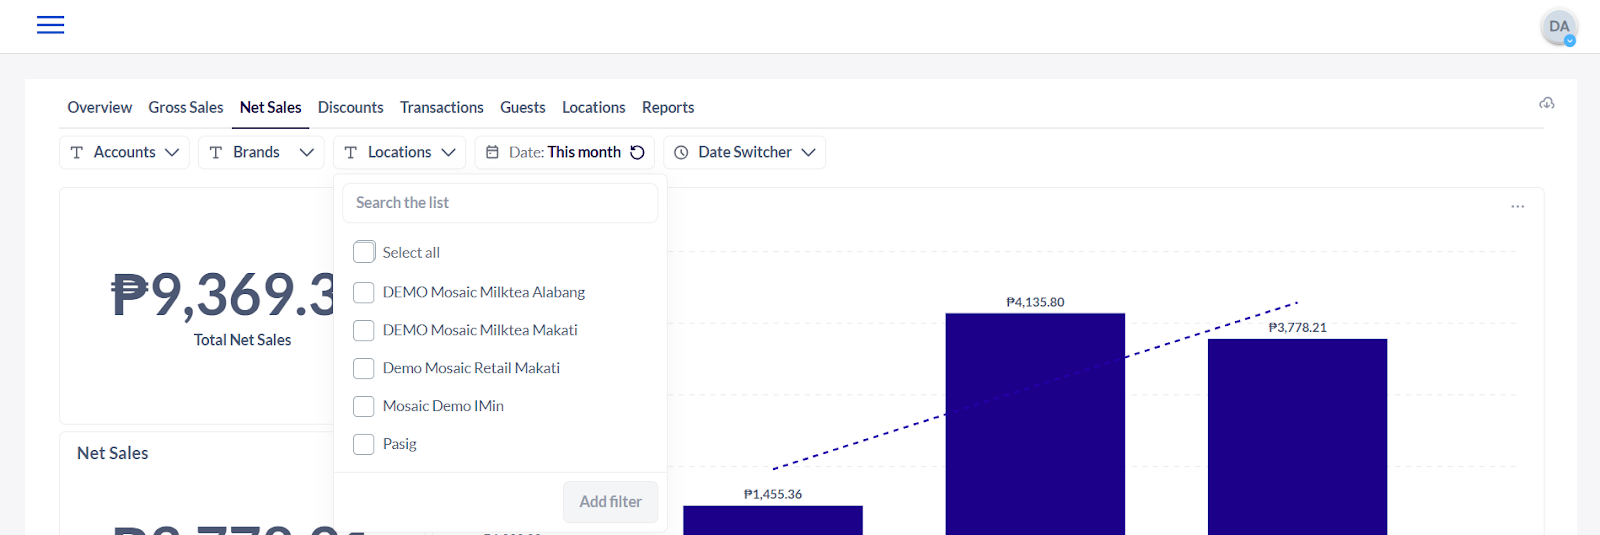
- The Location Filter shows you the date from the selected branch/location.
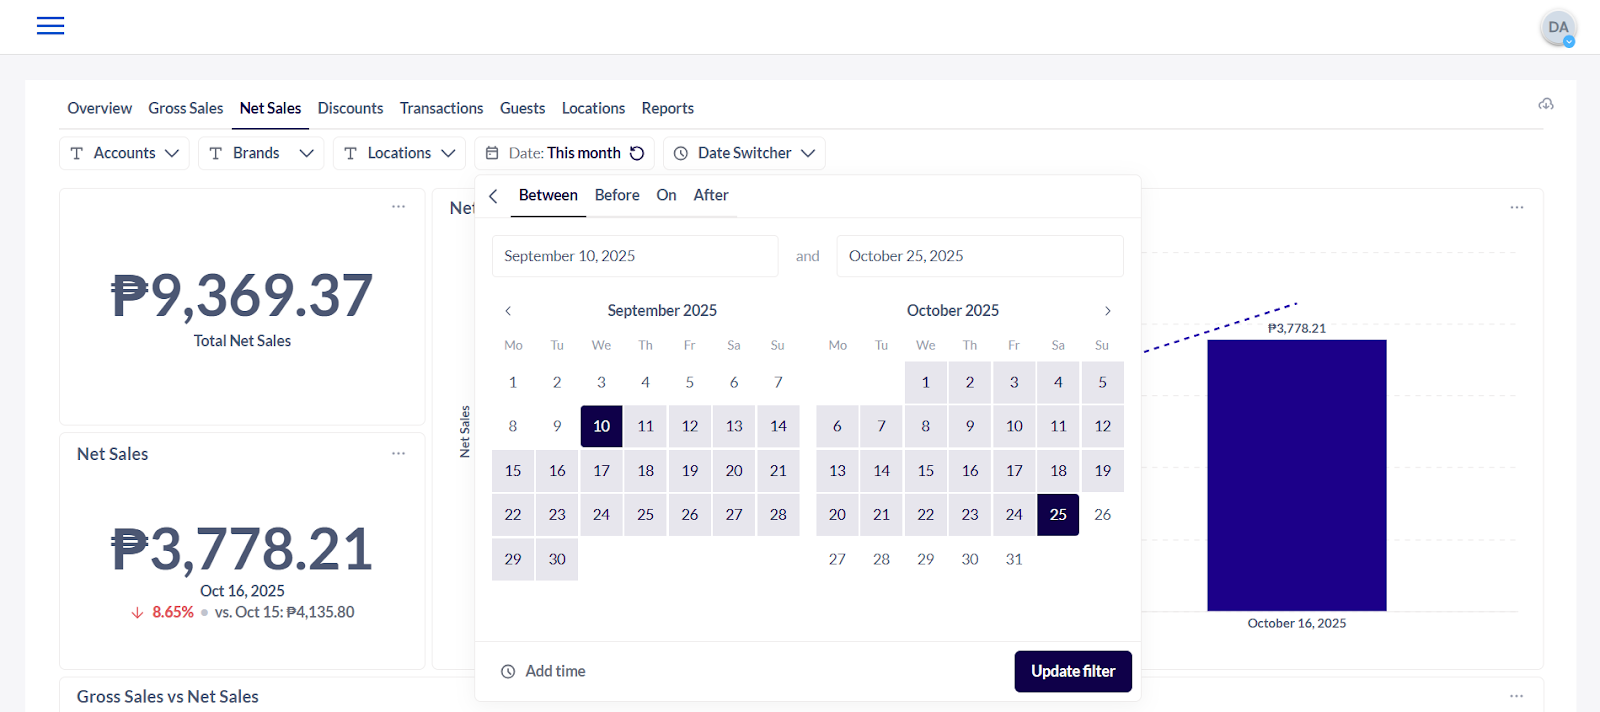
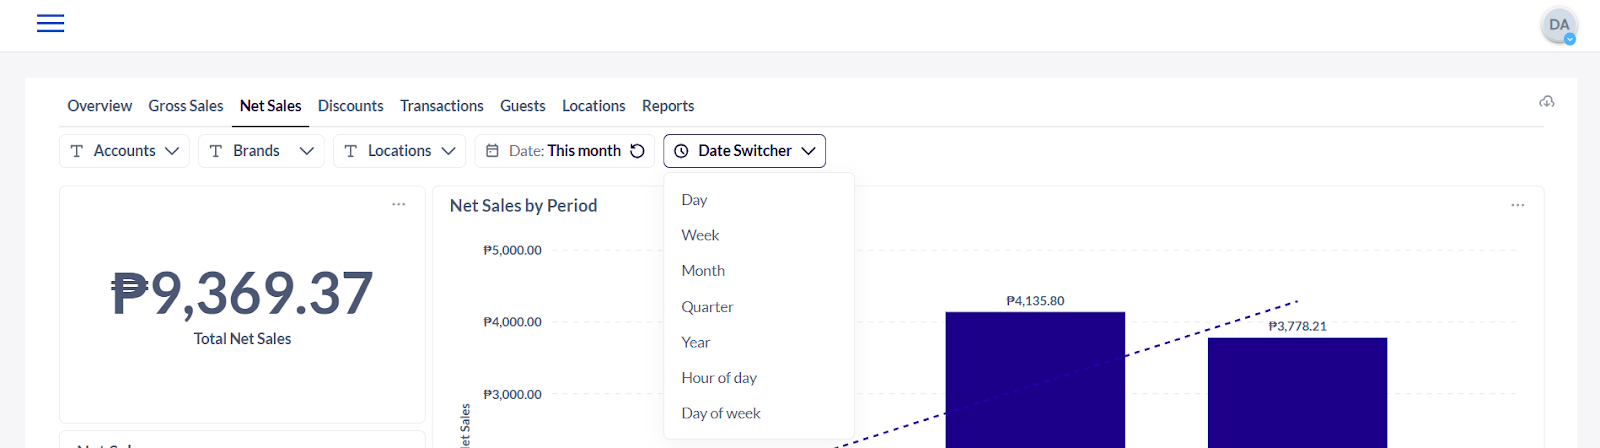
- The Date Filter lets you adjust the date range of the data that the user would like to generate.
- The Data Switcher Filter lets you select which frequency or timeline you would like to view the data.
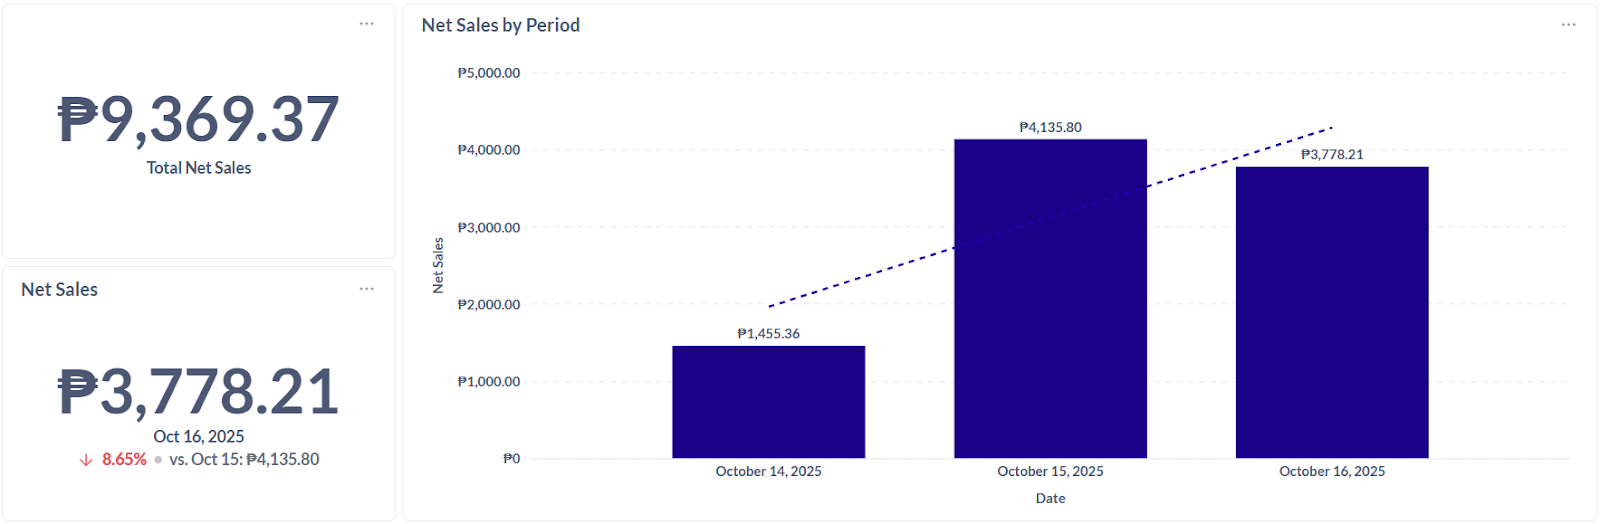
- Total Net Sales - The final sales revenue a company earns after subtracting all returns, discounts, and allowances from its gross sales.
- Net Sales - The amount of revenue a business earns from sales after deducting returns, discounts, and allowances from gross sales.
- Net Sales by Period - The total sales revenue earned during specific time intervals (daily, monthly, quarterly, or yearly) after subtracting returns, discounts, and allowances.
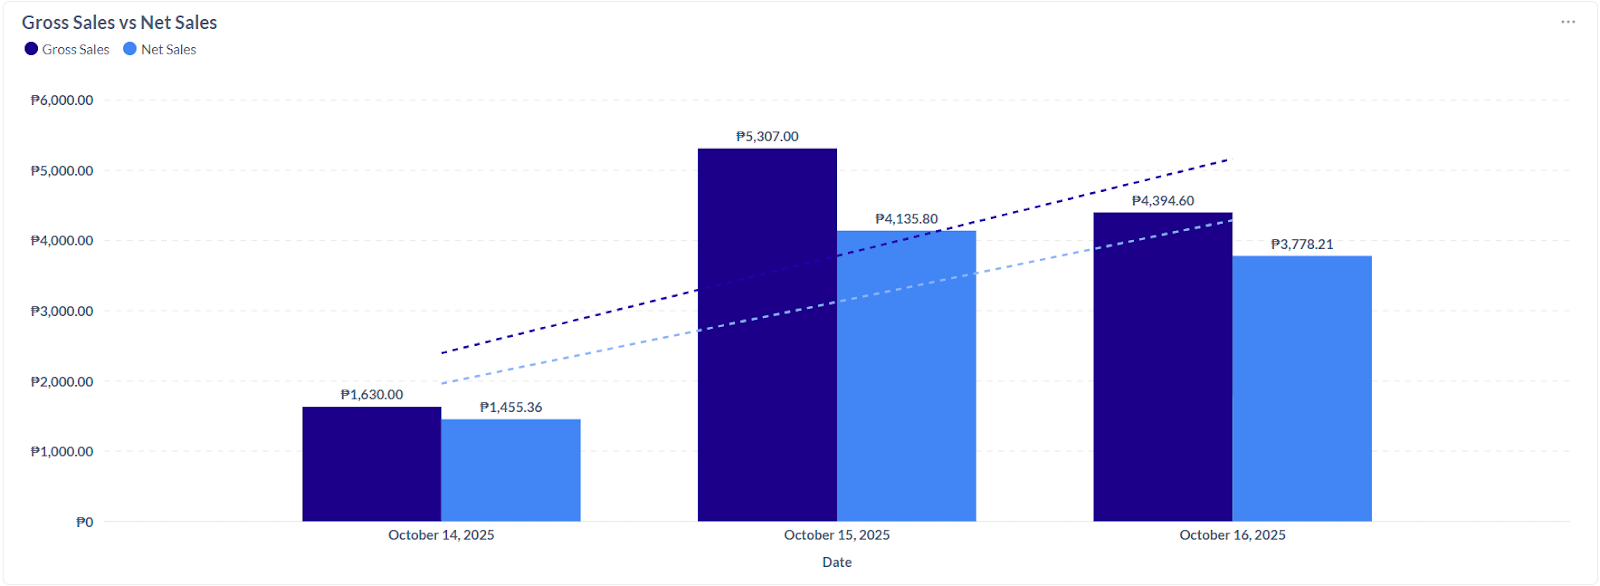
- Gross Sales vs Net Sales - Gross is the total amount of revenue, income, or value before any deductions are subtracted; Net is the final amount that remains after all relevant deductions (like returns, discounts, expenses, or taxes) have been taken out.
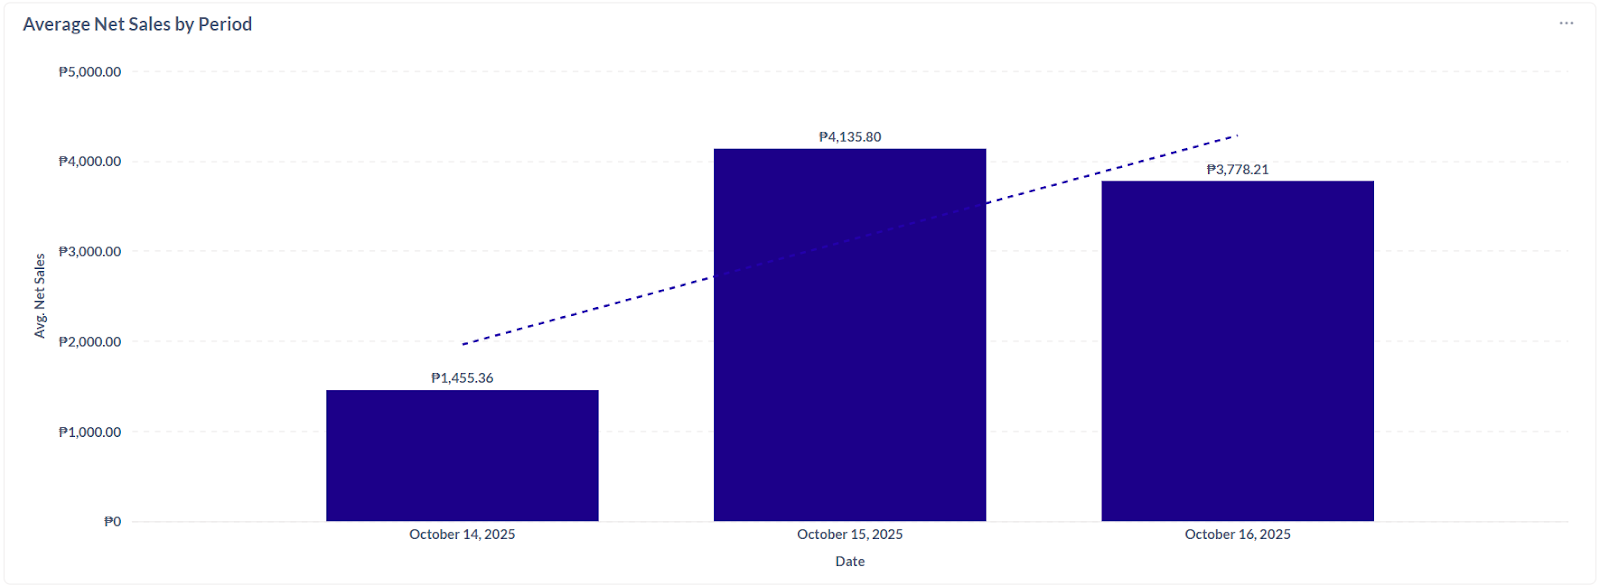
- Average Net Sales by Period - The mean net sales amount over a specific time frame, such as a week, month, or year calculated by dividing total net sales in the period by the number of intervals.
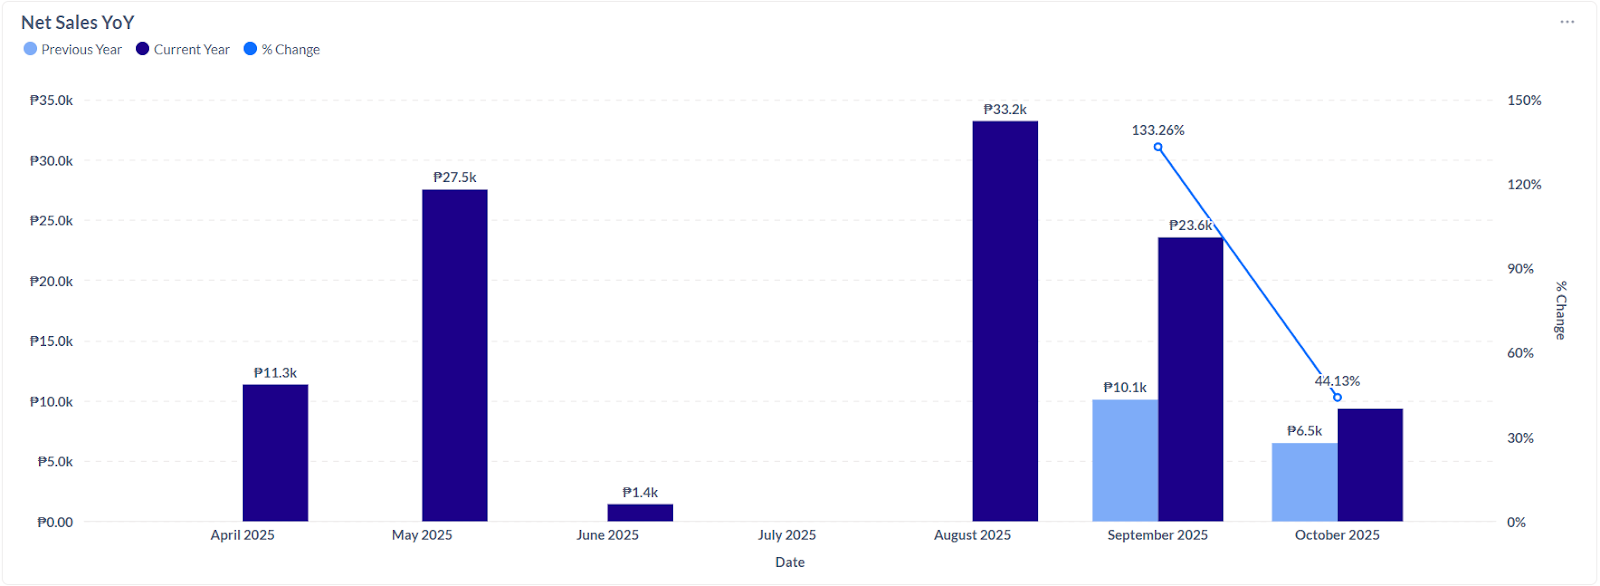
- Net Sales (YoY) - Compares the company’s net sales for a specific period with the same period in the previous year measuring annual growth or decline in actual sales revenue after accounting for returns, discounts, and allowances.
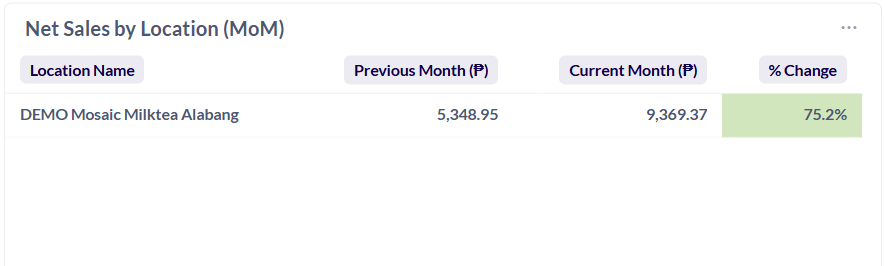
- Net Sales by Location (MoM) - The net sales for each location compared to the previous month, accounting for returns, discounts, and allowances and highlights short-term changes in performance at each location.
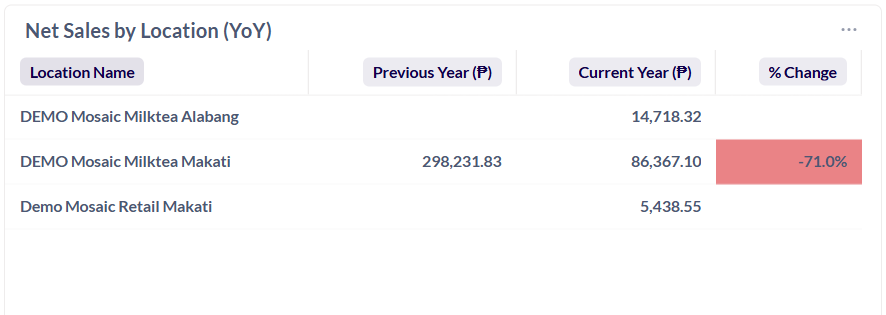
- Net Sales by Location (YoY) - The net sales of each location for a specific period with the same period in the previous year, accounting for returns, discounts, and allowances, highlighting annual growth or decline at each location.
Note: The tables and data may be downloaded by selecting the options icon (3-dots) at the top right corner of each window.