- Go to https://backoffice-console.mosaic-pos.com/#/auth/login
- Log in to the Mosaic Analytics using your account.
- Click “Log In”
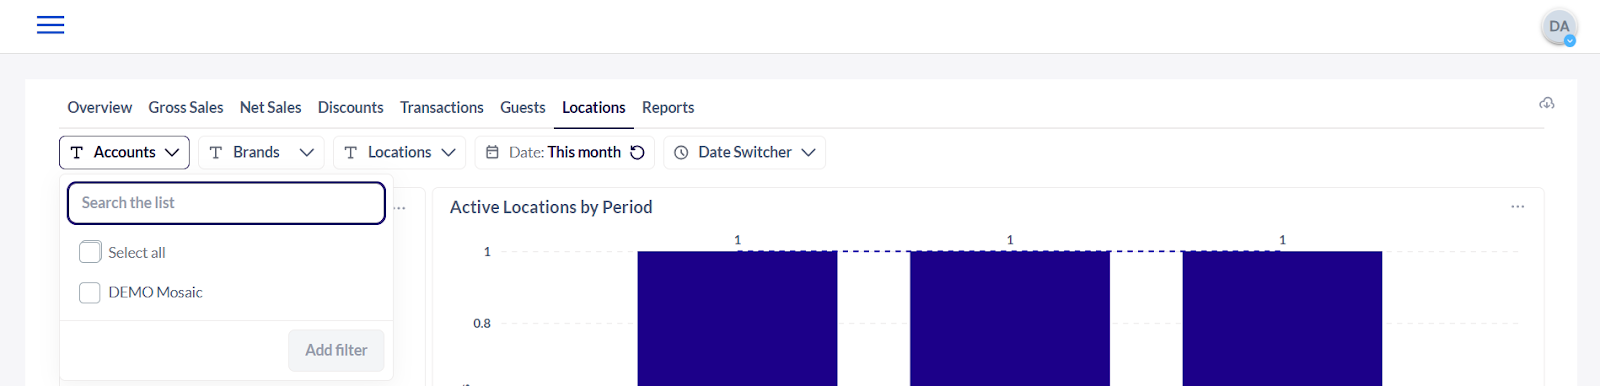
- The Account Filter lets you select the Account Name that is registered with Mosaic.
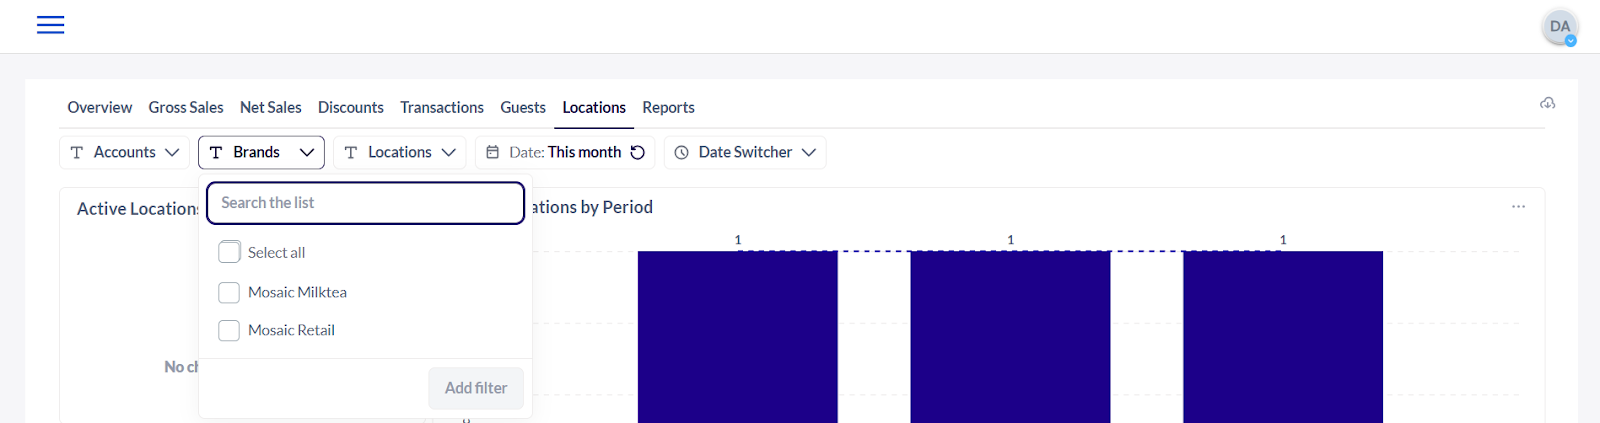
5. The Brand Filter lets you select the Brand Name that is associated with the registered account name.
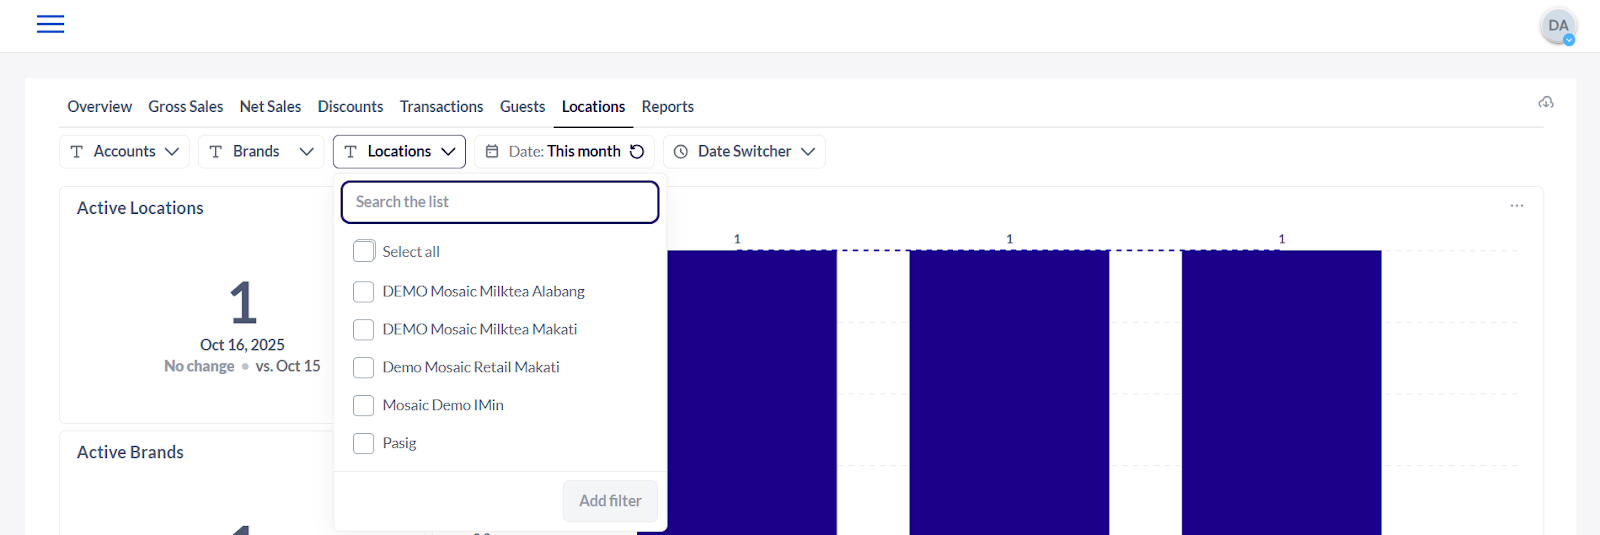
6. The Location Filter shows you the date from the selected branch/location.
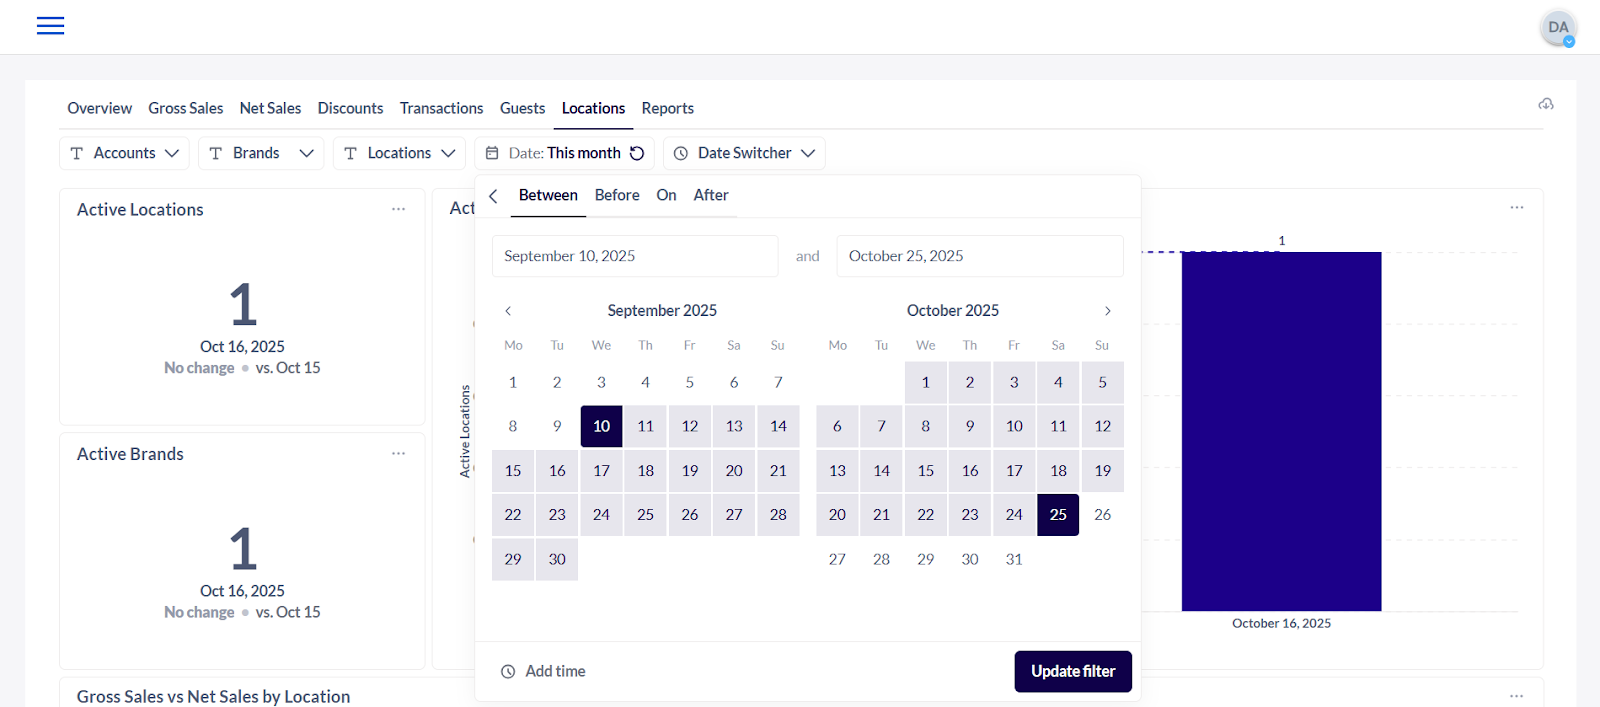
7. The Date Filter lets you adjust the date range of the data that the user would like to generate.
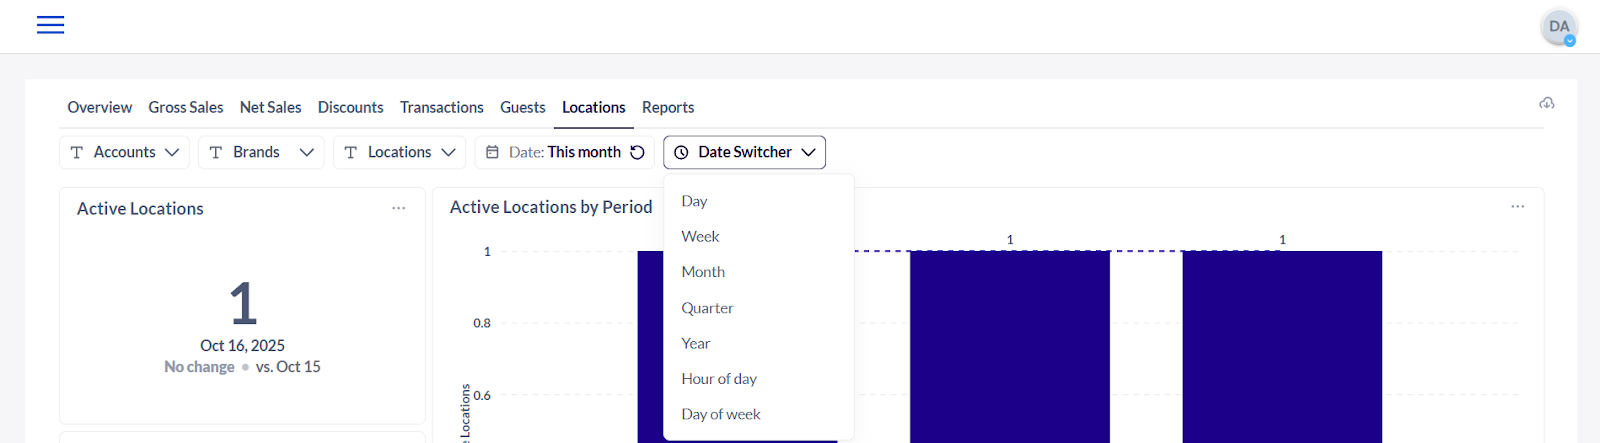
8. The Date Switcher Filter lets you select which frequency or timeline you would like to view the data.
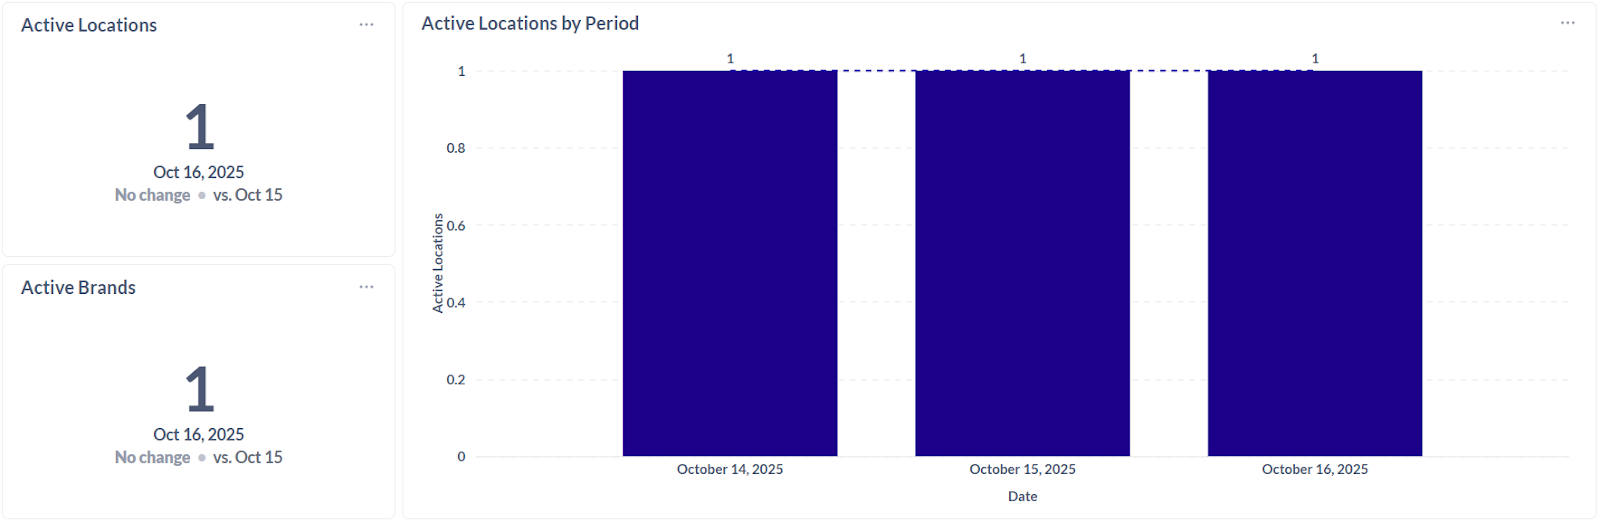
9. Active Locations - The number of store locations that have recorded at least one transaction during a specific period.
10. Active Brands - The number of brands or restaurant chains that have recorded sales or transactions during a given period.
11. Active Locations by Period - The count of locations that were operational and recorded transactions within a specific time frame (day, week, month, etc.), showing activity trends over time.
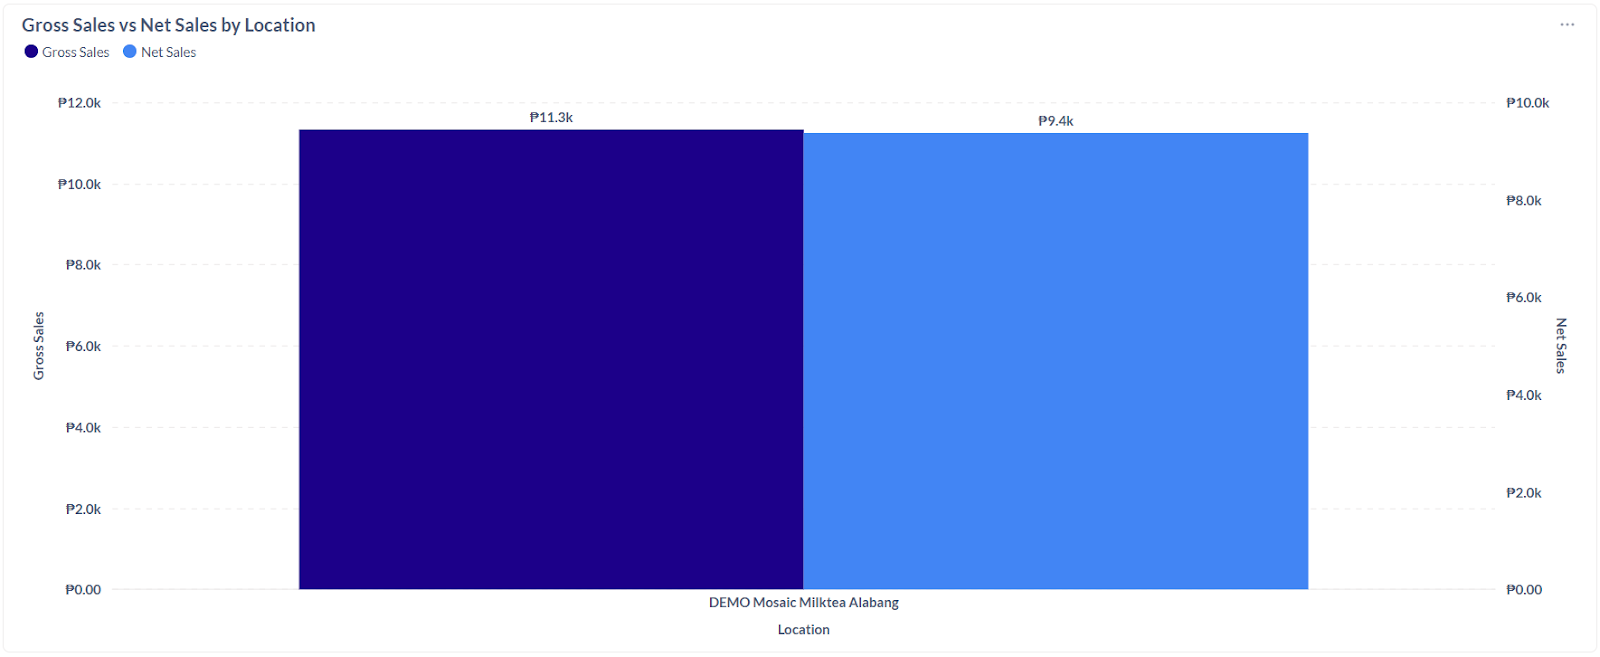
12. Gross Sales vs Net Sales by Location - Compares total sales before deductions (gross sales) with sales after deductions like discounts, returns, or allowances (net sales) for each restaurant or store location.
Note: The tables and data may be downloaded by selecting the options icon (3-dots) at the top right corner of each window.